4. Assume that the economy can be in three possible states next year: boom, normal, or slow economic growth. An expert source has calculated that P(boom)F.30, P(normal).50, and P(Slow 20. The returns for Stock A, RA, and Stock B, RB, under each of the economic states are provided in the table a) What is the expected value and standard deviation of the returns for stock A. E(Ra) (2*.3)(12*0.5)+(0.05*0.2)F0.13 Variance: (0.2-132(.3)+(12-.132(5)+(0.05-.132(.2)-0.024 St dev- (.024)A.5 0.0529 b) What is the expected value and standard deviation of the returns for stock c) What is the joint probability distribution for the returns of stock A and stock B? d) What are the covariance and the correlation coefficient of returns of stock A and stock B? Event Boom Normal Slow 0.3 0.5 0.2 0.20 0.12 0.05 0.30 0.10 0.00
4. Assume that the economy can be in three possible states next year: boom, normal, or slow economic growth. An expert source has calculated that P(boom)F.30, P(normal).50, and P(Slow 20. The returns for Stock A, RA, and Stock B, RB, under each of the economic states are provided in the table a) What is the expected value and standard deviation of the returns for stock A. E(Ra) (2*.3)(12*0.5)+(0.05*0.2)F0.13 Variance: (0.2-132(.3)+(12-.132(5)+(0.05-.132(.2)-0.024 St dev- (.024)A.5 0.0529 b) What is the expected value and standard deviation of the returns for stock c) What is the joint probability distribution for the returns of stock A and stock B? d) What are the covariance and the correlation coefficient of returns of stock A and stock B? Event Boom Normal Slow 0.3 0.5 0.2 0.20 0.12 0.05 0.30 0.10 0.00

Algebra & Trigonometry with Analytic Geometry
13th Edition
ISBN:9781133382119
Author:Swokowski
Publisher:Swokowski
Chapter10: Sequences, Series, And Probability
Section10.8: Probability
Problem 29E

Related questions
Question
Part D
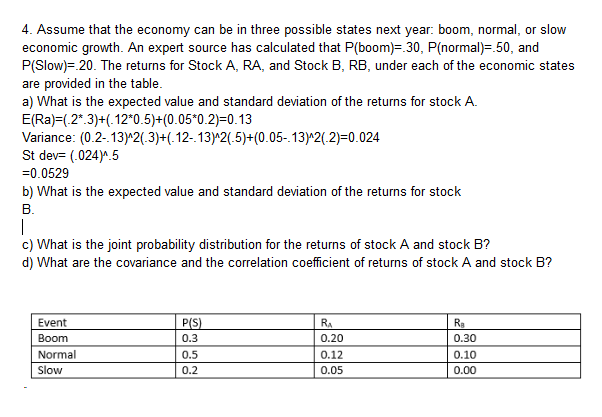
Transcribed Image Text:4. Assume that the economy can be in three possible states next year: boom, normal, or slow
economic growth. An expert source has calculated that P(boom)F.30, P(normal).50, and
P(Slow 20. The returns for Stock A, RA, and Stock B, RB, under each of the economic states
are provided in the table
a) What is the expected value and standard deviation of the returns for stock A.
E(Ra) (2*.3)(12*0.5)+(0.05*0.2)F0.13
Variance: (0.2-132(.3)+(12-.132(5)+(0.05-.132(.2)-0.024
St dev- (.024)A.5
0.0529
b) What is the expected value and standard deviation of the returns for stock
c) What is the joint probability distribution for the returns of stock A and stock B?
d) What are the covariance and the correlation coefficient of returns of stock A and stock B?
Event
Boom
Normal
Slow
0.3
0.5
0.2
0.20
0.12
0.05
0.30
0.10
0.00
Expert Solution


Trending now
This is a popular solution!

Step by step
Solved in 9 steps with 9 images

Knowledge Booster


Learn more about
Need a deep-dive on the concept behind this application? Look no further. Learn more about this topic, statistics and related others by exploring similar questions and additional content below.Recommended textbooks for you
Algebra & Trigonometry with Analytic Geometry
Algebra
ISBN:
9781133382119
Author:
Swokowski
Publisher:
Cengage

College Algebra
Algebra
ISBN:
9781305115545
Author:
James Stewart, Lothar Redlin, Saleem Watson
Publisher:
Cengage Learning
Algebra & Trigonometry with Analytic Geometry
Algebra
ISBN:
9781133382119
Author:
Swokowski
Publisher:
Cengage
College Algebra
Algebra
ISBN:
9781305115545
Author:
James Stewart, Lothar Redlin, Saleem Watson
Publisher:
Cengage Learning