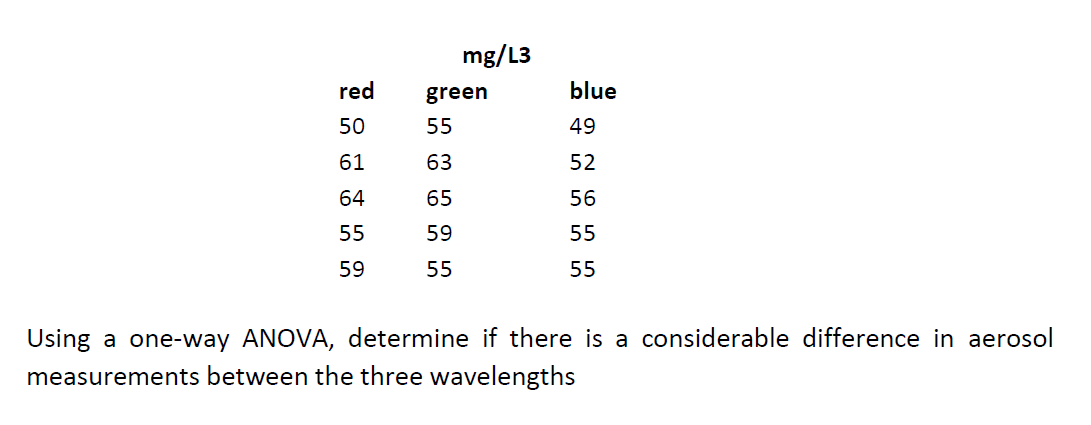
mg/L3 red green blue 50 55 49 61 63 52 64 65 56 55 59 55 59 55 55 Using a one-way ANOVA, determine if there is a considerable difference in aerosol measurements between the three wavelengths


Q: n soccer, a tie at the end of regulation time leads to a shootout by three members from each team.…
A: Given that Number of players available (n) = 11 Players need to be selected = 3 We know that We…
Q: A butcher at a certain store has the scales calibrated for accuracy. The scales must measure a…
A: a) The butcher at the certain store has the scales that measure a standardized 1-pound weight at…
Q: A test of hypothesis for Ho : µ = 5 against H. : µ # 5 was conducted using a statistical software.…
A: Given Population mean μ=5 Hypothesis Ho: μ=5 vs H1: μ≠5(Two tailed) Test statistic =-0.96, p…
Q: The most important measure in any business is a successful purchase of their product. Task success…
A: The expectation of a discrete random variable X, denoted by E(X), is defined as a measure of central…
Q: 1. What are the dependent/ independent variables in a correlational study of ice cream sales and air…
A: Here we want to know dependent and independent variable.
Q: 40. A survey was conducted in a large city to investigate public opinion on banning the use of trans…
A: From the provided information,
Q: 1.Plot the data points in a graph with inflation rate on the vertical axis and unemployment rate on…
A: Since you have asked multiple questions, we will solve the first question for you. If you want any…
Q: What is the average profit you can make if you participate this game?
A: A die is rolled. If an odd number turns up, we win an amount equal to this number; if an even number…
Q: Correlation studies are often used to help determine whether certain characteristics are controlled…
A: (a) Obtain the correlation between the variables children and their birth parents. Use EXCEL to…
Q: Given the following data: 8, 3, 3, 17, 9, 22, 19, find the mean.
A: Given data: 8, 3, 3, 17, 9, 22, 19
Q: In a between subjects design, individual differences (participant variables) are a problem because…
A: We have the following statement about the design of experiment A confounding variable is a variable…
Q: For the accompanying data set, (a) draw a scatter diagram of the data, (b) compute the correlation…
A: The independent variable is x. The dependent variable is y. We have to find the correlation…
Q: For a binomial distribution with p = 0.20 and n = 25, what is the z-score for X = 12? Select one:…
A: Given that Number of trials n=25 Success of probability p =0.20 X~binomial ( n,p)
Q: You are conducting a multinomial hypothesis test (α = 0.05) for the claim that all 5 categories are…
A: For the given data Perform chi square goodness of fit
Q: Statistics students in Oxnard College sampled 9 textbooks in the Condor bookstore and recorded the…
A:
Q: A cement manufacturer claims that the average weight of his product is 40 kgs. 3. with a standard…
A:
Q: For the following data please, d) give information about the skewness of the distribution e) plot…
A: Given Data: 55, 59, 57, 59, 58, 60, 57, 56, 58, 61, 58
Q: . How many different 1-scoop ice cream cones can a customer order?
A: We have given that Types of cones = 3 Number of flavours of ice-cream = 31
Q: Find the correlation coefficient using Rank correlation (s
A: here use studying in hour = X marks = Y
Q: you develope a way to Measure anger people. Test the Claim that the mean. for etler Of anger for…
A:
Q: The random variable X, the particle size (in micrometers) distribution is characterized by the…
A: Obtain the probability that X exceeds 1.8 micrometers. The probability that X exceeds 1.8…
Q: A manufacturer's process produces basketballs that have a population mean diameter of 9.47 inches…
A:
Q: IN A Sample you had 6503 out of 8896 voters who Supported a candidate. Test that the proportion of…
A: Given that Sample size n =8896 Favorable cases x =6503 Sample proportion p^=x/n =6503/8896 =0.7310
Q: 3. A set of data with a correlation coefficient of -0.55 has a strong negative linear correlation…
A: Given: A set of data with a correlation coefficient of-0.55 has a a. strong negative linear…
Q: Please Provide: Frequency Distribution Table Containing:
A: A frequency distribution table summarizes the frequency of the data in a tabular form.
Q: find the probability when X is less than equal to 1
A: We have given that Sample size n = 7 favourable cases x = 3 P( defective ) = p = 3/7
Q: You are conducting a test of independence for the claim that there is an association between the row…
A: For the given data perform chi square test
Q: A butcher at a certain store has the scales calibrated for accuracy. The scales must measure a…
A: a) It is given that, the butcher at the certain store has the scales that measure a standardized…
Q: 24. A study was conducted to evaluate the impact of taking a nutritional supplement on a person's…
A: Given that 24. A study was conducted to evaluate the impact of taking a nutritional supplement on…
Q: 下午1:55 4月21日周四 * 77%O 31. An experiment was conducted to investigate the relationship between the…
A:
Q: CHICKEN FEED ADDITIVE STUDY Instruction: For all test of hypotheses, write Ho and Ha in words,…
A: Since you have asked multiple questions, we will solve the first question for you. If you want any…
Q: the world. A sample of 30 of countries was selected, and a stem-and-leaf plot of the per capita…
A: Given: Sample size, n = 30 ∑i=1nxi = 802∑i=1nx2i = 24,560
Q: New Authors Established Authors Total Successful 24 100 124 Unsuccessful 60 216 276 Total 84 316 400…
A: The number of values corresponding to a class or observation is defined as the frequency of that…
Q: Keep in mind that the words in bold below have technical and formal meanings in statistics. "An…
A: We have the following statement about the Estimator that is consistent.
Q: For this exercise, round all regression parameters to three decimal places. The table below shows…
A: Given that
Q: The credit manager of a department store believes the average age of charge-account customers is…
A: From the provided information, Sample size (n) = 50 Sample mean (x̄) = 47 Standard deviation (s) = 9…
Q: 1. Wi-Fi Access A survey of 50 students in grades 4 through 12 found 68% have classroom Wi-Fi…
A: Given that n=50 , p=68%=0.68
Q: When your doctor asks you whether you have been sleeping well at night, the doctor is gathering…
A: We have given the following statement.
Q: Americans who believe the government should ensure basic health care is _________% with a margin of…
A:
Q: A company wants to determine whether its consumer produc ungs (0- 10) have changed from last year to…
A: For the given data Perform t test for paired
Q: 12: One researcher estimated that smoking reduces the sense of smell. The mean of the odor test for…
A: Given that Population mean μ =18.4 Sample size n =12
Q: The expected observations for this table would be Category Population #1 Population #2 A B…
A: The data is given by Category Population 1 Population2 Total A 14 95 109 B 66 39 105…
Q: Two varieties of corn are grown in 4 different locations. Each location provides a value in pounds…
A: Given that Variety 1 Variety 2 difference location 1 32.1 34.5 -2.4 location 2 30.6 32.6…
Q: study the effect of alcohol on reaction time. It is known that under regular circumstances the…
A:
Q: follows a'binomjal distabutton WiI D=300and P= 0.7 (a)Explain why distnbutoa (6)lnstead of using the…
A: Here Given Proportion of Customer order paperoni on Pizza=p=0.7 n=300
Q: 404 3. Using Table G, find the values for xleft and xright- a. a = 0.05, n 12 b. a= 0.10, n = 20 G…
A: The critical value for chi square. Degree of freedom =df = n-1 NOTE:- According to bartleby…
Q: how many ways can you invite at least 7 of your 10 friends?
A: Given that Total number friends (n) = 10 Number of friends to invite = At least 7 We know that…
Q: From a well-shuffled standard deck of 52 cards, one card is to be selected. What is the probability…
A: In a standard deck of playing cards there are total 52 cards and 4 suits, such as hearts, diamonds,…
Q: A researcher were conducted in the effect of outdoor activity on mood. She hypotthesized that…
A: Step 1: Null Hypothesis: H0: There is no difference in the means between before mode and after mode.…
Q: Referring to the table below, compute the following: 1. Q1 2. b. Q3 3. c. D7 4. Dg 5. P65 6. P74 Age…
A: Class Frequency 5 - 9 10 10 - 14 16 15 - 19 20 20 - 24 18 25 - 29 14 30 - 34 10…
Pls show complete solution

Step by step
Solved in 4 steps with 2 images

- A study is designed to evaluate the impact of a daily multivitamin on students’ academic performance. One hundred sixty students are randomly assigned to receive either the multivitamin or a placebo and are instructed to take the assigned drug daily for 20 days. On day 20, each student takes a standardized exam and the mean exam scores are compared between groups. This study is an example of a Randomized Control trial. True FalseIn a repeated measures ANOVA, SSwithin is analyzed into two components. They are _______. a) between treatments and between subjects b) between subjects and error c) within subjects and between subjects d) between trteatments and errorThe Ministry of Health is interested in determining whether the average nicotine content of regular, menthol, and filtered cigarettes for 16 different brands differ. The data from the sample is provided below. Define the null and alternative hypothesis for the ANOVA model. Calculate the missing values for the ANOVA table above. What is your conclusion for the ANOVA results?
- "Analysis of Incomplete Sleep Stages Associated With Sleep Deprivation and Its Physical Health Effects to Students During A Global Pandemic" For this research, what would be the appropriate: Research Design Sampling Procedure Statistical Treatment InterventionA study was made of 1,057 cases of poisoning in children treated as inpatients at Milwaukee Children's Hospital from 1962 through 1968. Data on date of occurrence, age and sex of the child, and type of agent involved were recorded and analyzed by standard statistical methods. Poisoning was due to ingestion of aspirin in 35 per cent of the children studied and to the ingestion of hydrocarbon distillates in 18 per cent. A statistically significant male dominance was found for ingestion of hydrocarbons; age-specific peaks were found for some categories. Trends as to the relative and absolute frequencies of each specific poison from one year to the next were noted; possible reasons for increasing or decreasing trends are discussed. Is this study descriptive or inferential? Explain your answer. What are the variables used in the study? In your opinion, what level of measurement was used to obtain the data from the variables? Does the article define the population? If so, how is it…Determine the effects of gender and type of high school graduated from on the college entrance examination scores of the students. (TWO WAY ANOVA)
- Job Gains and Losses. In the article “Business Employment Dynamics: New Data on Gross Job Gains and Losses” (Monthly Labor Review, Vol. 127, Issue 4, pp. 29–42), J. Spletzer et al. examined gross job gains and losses as a percentage of the average of previous and current employment figures. A simple random sample of 20 quarters provided the net percentage gains (losses are negative gains) for jobs as presented on the WeissStats site. Use the technology of your choice to do the following. a. Decide whether, on average, the net percentage gain for jobs exceeds 0.2. Assume a population standard deviation of 0.42. Apply the one-mean z-test with a 5% significance level. b. Obtain a normal probability plot, boxplot, histogram, and stemand-leaf diagram of the data. c. Remove the outliers (if any) from the data and then repeat part (a). d. Comment on the advisability of using the z-test here.Hospital Stays. The U.S. National Center for Health Statistics collects data on length of stay in noninstitutional, short-stay hospitals by sex and age. Results are published in Vital and Health Statistics. Independent random samples of Americans were taken to compare the lengths of stay (in days) for males and females in four age groups (15–24 years, 25–34 years, 35–44 years, and 45–64 years). The data are provided in the following table. We performed a two-way ANOVA on the data.Data for head injury measurements (in HIC, which is a standard head injury criterion) from samples of small, midsize, and large cars involved in the standard crash test were used to produce the accompanying ANOVA table. Using a 0.05 significance level, test the claim that the different size categories have the same mean head injury measurement. Does the size of a car appear to affect head injuries? ANOVA table Dialog content starts Sum of Squares df Mean Square F Sig. Between Groups 73630.272 2 36815.136 1.606 0.227 Within Groups 435546.443 19 22923.497 Total 509176.715 21 What are the hypotheses to test? H0: H1: The test statistic is (Round to two decimal places as needed.) The P-value is (Round to three decimal places as needed.) ___________H0. Since the P-value is__________than the significance level, there ___________sufficient evidence to refute the claim that the different size…
- The purpose a of post hoc test is to? determine whether or not the type one error/Alpha error was made in ANOVA determine which group are different Determine the effects size of the total variability between all groupsThe repeated-measures ANOVA is a two-stage process. Which of the following accurately describes what happens during this process. Group of answer choices