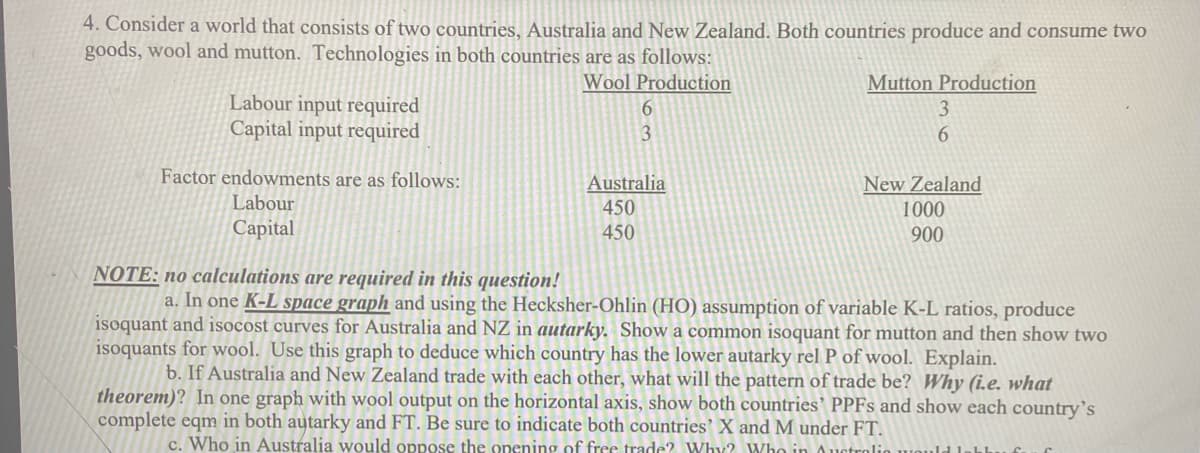
4. Consider a world that consists of two countries, Australia and New Zealand. Both countries produce and consume two goods, wool and mutton. Technologies in both countries are as follows: Wool Production Mutton Production Labour input required Capital input required 6. 3. Factor endowments are as follows: Australia 450 450 New Zealand 1000 Labour Capital 900 NOTE: no calculations are required in this question! a. In one K-L space graph and using the Hecksher-Ohlin (HO) assumption of variable K-L ratios, produce isoquant and isocost curves for Australia and NZ in autarky. Show a common isoquant for mutton and then show two isoquants for wool. Use this graph to deduce which country has the lower autarky rel P of wool. Explain. b. If Australia and New Zealand trade with each other, what will the pattern of trade be? Why (i.e. what theorem)? In one graph with wool output on the horizontal axis, show both countries' PPFS and show each country's complete eqm in both autarky and FT. Be sure to indicate both countries' X and M under FT. c. Who in Australia would oppose the onening of frce trade? Why? Who in


The Hecksher-Ohlin (HO) theory takes into account two countries, two commodities, and two factors (labour and capital). It is an undeniable reality that different countries have different endowments or availability of variables. There may be an abundance of capital in country A, yet labour may be limited. On the other hand, Country N may have an excess of labour. If and only if, a country is considered to be comparably capital abundant if it has a larger capital-to-labor ratio than the other country.
Given that
| Wool Production | Mutton Production | |
| Labour inputs required | 6 | 3 |
| Capital input required | 3 | 6 |
Factor endowments
| Country A | Country N | |
| Labour | 450 | 1000 |
| Capital | 450 | 900 |
It can be seen from the above tables that country N is relatively both capital abundant and Labour abundant
Capital abundant condition
Labour abundant condition
Where the K and L stand for capital and labour, respectively. The letters A and N stand for the countries A and N, respectively.

Step by step
Solved in 3 steps with 2 images


