4. (Economics Powertool graph paper required) In the Keynesian cross, assume that the consumption function is given by C(Y – T) = 1425 + 0. 72(Y – T') The planned investment function is I(r) 1800 – 130r and government purchases and taxes are both 120. a. Suppose r = 8. Graph the Keynesian cross where Y goes from 0 to 10,000. Be sure to label the axes and the planned expenditure function as PE. b. What is the equilibrium level of income? Show this on your graph as Yo. c. Make a high resolution graph of the Keynsian cross where the Y-axis goes from 7900 to 8000. Be sure to label the axes and the planned expenditure function as PE,.
4. (Economics Powertool graph paper required) In the Keynesian cross, assume that the consumption function is given by C(Y – T) = 1425 + 0. 72(Y – T') The planned investment function is I(r) 1800 – 130r and government purchases and taxes are both 120. a. Suppose r = 8. Graph the Keynesian cross where Y goes from 0 to 10,000. Be sure to label the axes and the planned expenditure function as PE. b. What is the equilibrium level of income? Show this on your graph as Yo. c. Make a high resolution graph of the Keynsian cross where the Y-axis goes from 7900 to 8000. Be sure to label the axes and the planned expenditure function as PE,.

Essentials of Economics (MindTap Course List)
8th Edition
ISBN:9781337091992
Author:N. Gregory Mankiw
Publisher:N. Gregory Mankiw
Chapter18: Savings,investment And The Financial System
Section: Chapter Questions
Problem 5PA

Related questions
Question
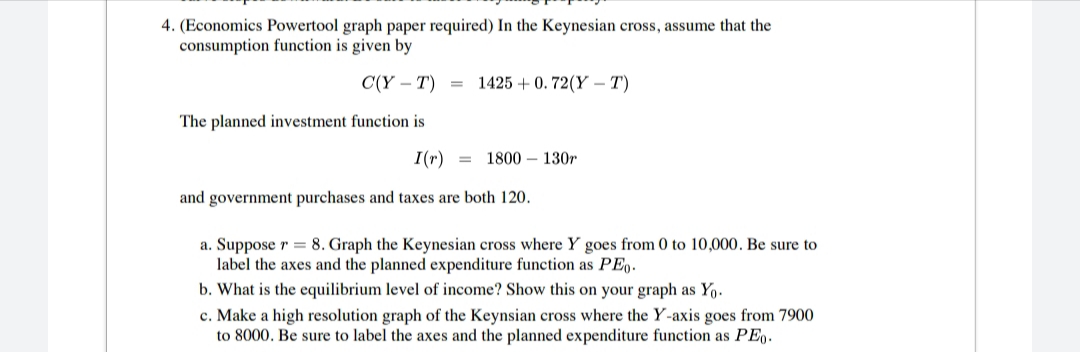
Transcribed Image Text:4. (Economics Powertool graph paper required) In the Keynesian cross, assume that the
consumption function is given by
C(Y – T) =
1425 + 0. 72(Y –T)
The planned investment function is
I(r) =
1800 – 130r
and government purchases and taxes are both 120.
a. Suppose r = 8. Graph the Keynesian cross where Y goes from 0 to 10,000. Be sure to
label the axes and the planned expenditure function as PE,.
b. What is the equilibrium level of income? Show this on your graph as Yo.
c. Make a high resolution graph of the Keynsian cross where the Y-axis goes from 7900
to 8000. Be sure to label the axes and the planned expenditure function as PE.
Expert Solution
This question has been solved!
Explore an expertly crafted, step-by-step solution for a thorough understanding of key concepts.

This is a popular solution!

Trending now
This is a popular solution!

Step by step
Solved in 3 steps with 3 images

Recommended textbooks for you
Essentials of Economics (MindTap Course List)
Economics
ISBN:
9781337091992
Author:
N. Gregory Mankiw
Publisher:
Cengage Learning

Brief Principles of Macroeconomics (MindTap Cours…
Economics
ISBN:
9781337091985
Author:
N. Gregory Mankiw
Publisher:
Cengage Learning
Essentials of Economics (MindTap Course List)
Economics
ISBN:
9781337091992
Author:
N. Gregory Mankiw
Publisher:
Cengage Learning
Brief Principles of Macroeconomics (MindTap Cours…
Economics
ISBN:
9781337091985
Author:
N. Gregory Mankiw
Publisher:
Cengage Learning