4. Explain what happens to the surface area to volume ratio as cell side length (cell size) continues to increase. What are the implications for very large cells? What are the implications for very small cells?


What happens to SA:V ratio as cell side length (cell size) continues to increase? Plot these two sets of values according to the directions below to see what the trend is when cell side length continues to increase.
1. Plot a line graph of SA:V ratio on the y-axis and cell side length on the x-axis.
2. Log transform the y-axis to make the relationship more clear using the following steps.
a. Click on the y-axis values; a box will appear around the values.
b. Right click inside the box and choose the Format Axis command from the shortcut menu that appears.
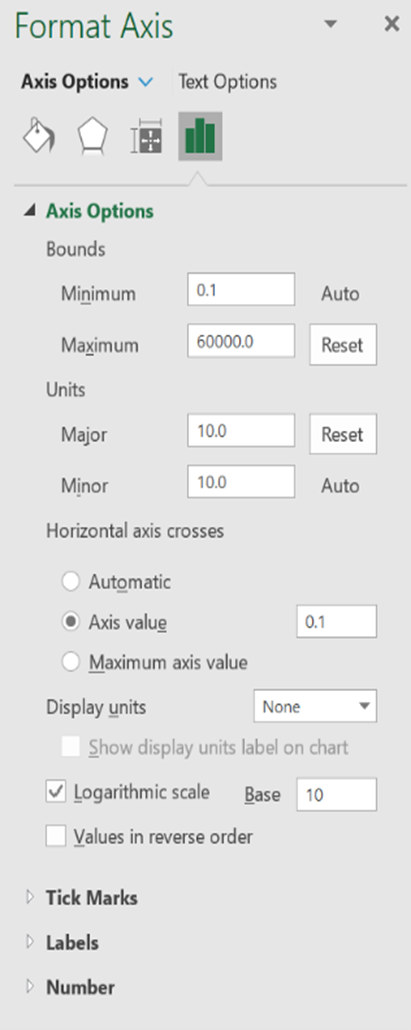
c. When the Format Axis dialog box appears, select the Axis Options entry from the list box.
d. Enter the values from the screenshot in the Axis Options.
3. Properly title and label this graph.
4. Explain what happens to the surface area to volume ratio as cell side length (cell size) continues to increase. What are the implications for very large cells? What are the implications for very small cells?
(Use excel spreadsheet)

Step by step
Solved in 4 steps


