What happens to SA:V ratio as cell side length (cell size) continues to increase? Plot these two sets of values according to the directions below to see what the trend is when cell side length continues to increase. 1. Plot a line graph of SA:V ratio on the y-axis and cell side length on the x-axis. 2. Log transform the y-axis to make the relationship more clear using the following steps. a. Click on the y-axis values; a box will appear around the values. b. Right click inside the box and choose the Format Axis command from the shortcut menu that appears. c. When the Format Axis dialog box appears, select the Axis Options entry from the list box. d. Enter the values from the screenshot in the Axis Options. 3. Properly title and label this graph.


Molecular Techniques
Molecular techniques are methods employed in molecular biology, genetics, biochemistry, and biophysics to manipulate and analyze nucleic acids (deoxyribonucleic acid (DNA) and ribonucleic acid (RNA)), protein, and lipids. Techniques in molecular biology are employed to investigate the molecular basis for biological activity. These techniques are used to analyze cellular properties, structures, and chemical reactions, with a focus on how certain molecules regulate cellular reactions and growth.
DNA Fingerprinting and Gel Electrophoresis
The genetic makeup of living organisms is shown by a technique known as DNA fingerprinting. The difference is the satellite region of DNA is shown by this process. Alex Jeffreys has invented the process of DNA fingerprinting in 1985. Any biological samples such as blood, hair, saliva, semen can be used for DNA fingerprinting. DNA fingerprinting is also known as DNA profiling or molecular fingerprinting.
Molecular Markers
A known DNA sequence or gene sequence is present on a chromosome, and it is associated with a specific trait or character. It is mainly used as a genetic marker of the molecular marker. The first genetic map was done in a fruit fly, using genes as the first marker. In two categories, molecular markers are classified, classical marker and a DNA marker. A molecular marker is also known as a genetic marker.
DNA Sequencing
The most important feature of DNA (deoxyribonucleic acid) molecules are nucleotide sequences and the identification of genes and their activities. This the reason why scientists have been working to determine the sequences of pieces of DNA covered under the genomic field. The primary objective of the Human Genome Project was to determine the nucleotide sequence of the entire human nuclear genome. DNA sequencing selectively eliminates the introns leading to only exome sequencing that allows proteins coding.
What happens to SA:V ratio as cell side length (cell size) continues to increase? Plot these two sets of values according to the directions below to see what the trend is when cell side length continues to increase.
1. Plot a line graph of SA:V ratio on the y-axis and cell side length on the x-axis.
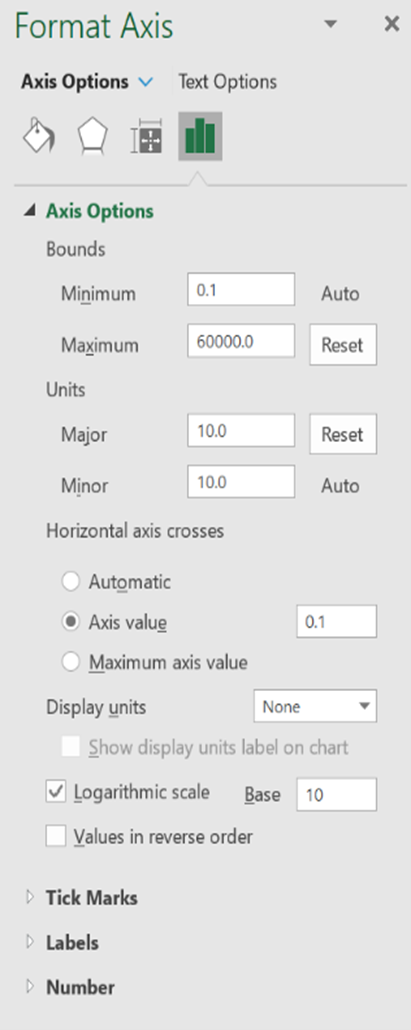
2. Log transform the y-axis to make the relationship more clear using the following steps.
a. Click on the y-axis values; a box will appear around the values.
b. Right click inside the box and choose the Format Axis command from the shortcut menu that appears.
c. When the Format Axis dialog box appears, select the Axis Options entry from the list box.
d. Enter the values from the screenshot in the Axis Options.
3. Properly title and label this graph.
4. Explain what happens to the surface area to volume ratio as cell side length (cell size) continues to increase. What are the implications for very large cells? What are the implications for very small cells?
(Use excel spreadsheet)


Step by step
Solved in 3 steps with 1 images


