xplain using evidence from graph a and graph b which graph indicates that the model for the data is a good fit .
xplain using evidence from graph a and graph b which graph indicates that the model for the data is a good fit .

Glencoe Algebra 1, Student Edition, 9780079039897, 0079039898, 2018
18th Edition
ISBN:9780079039897
Author:Carter
Publisher:Carter
Chapter4: Equations Of Linear Functions
Section: Chapter Questions
Problem 8SGR

Related questions
Question
Explain using evidence from graph a and graph b which graph indicates
that the model for the data is a good fit .
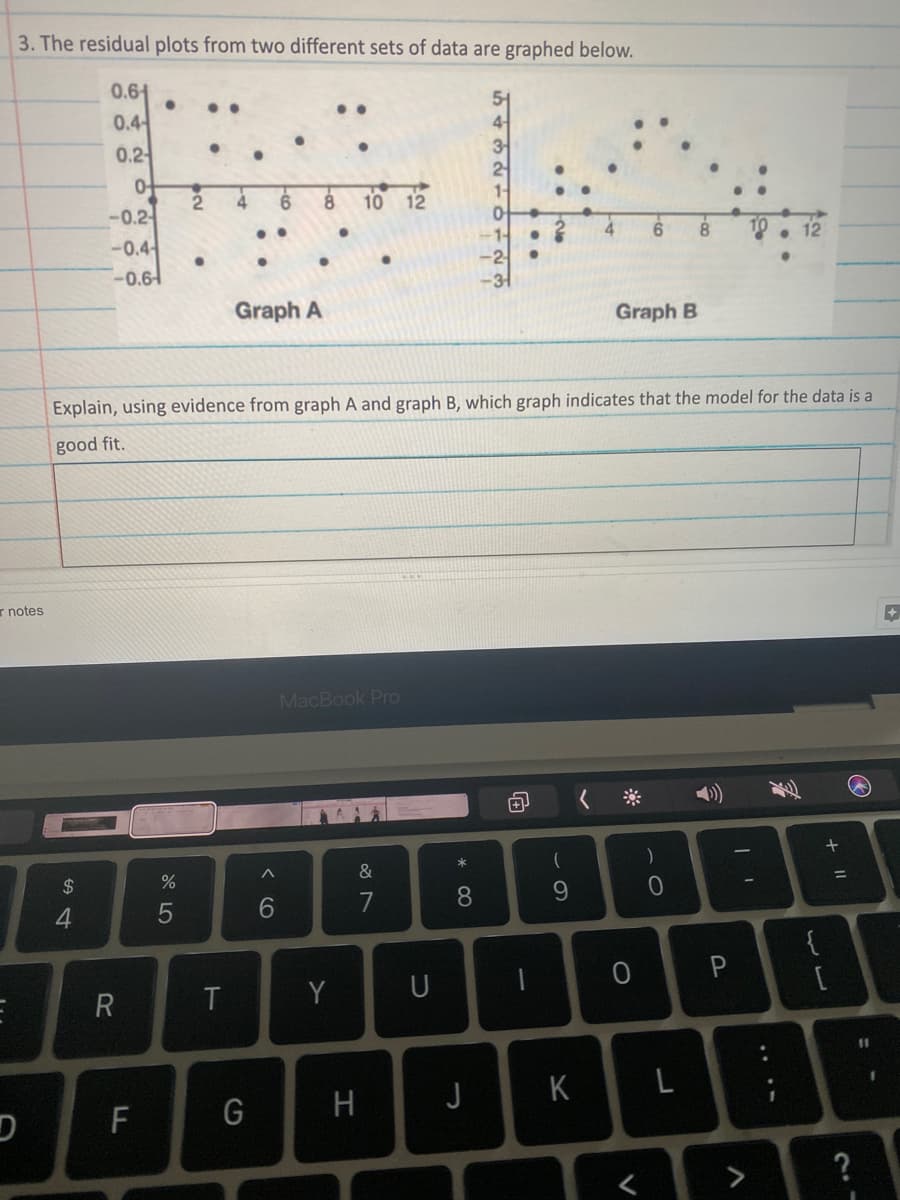
Transcribed Image Text:3. The residual plots from two different sets of data are graphed below.
0.61
..
..
0.4
4-
3
0.2
2
-0.2-
4
10 12
4
6.
10
-0.4
-0.61
Graph A
Graph B
Explain, using evidence from graph A and graph B, which graph indicates that the model for the data is a
good fit.
r notes
MacBook Pro
&
2$
6.
7
8
9.
4
{
R
Y
U
%3D
G
H
J
K
F
>
+ I|
....
V
ト
Expert Solution
This question has been solved!
Explore an expertly crafted, step-by-step solution for a thorough understanding of key concepts.

Step by step
Solved in 2 steps with 2 images

Knowledge Booster


Learn more about
Need a deep-dive on the concept behind this application? Look no further. Learn more about this topic, statistics and related others by exploring similar questions and additional content below.Recommended textbooks for you
Glencoe Algebra 1, Student Edition, 9780079039897…
Algebra
ISBN:
9780079039897
Author:
Carter
Publisher:
McGraw Hill
Glencoe Algebra 1, Student Edition, 9780079039897…
Algebra
ISBN:
9780079039897
Author:
Carter
Publisher:
McGraw Hill