4. In a certain garden which has been treated with agro chemicals, new plants grow at an average rate of 10% within a square meter. When this same garden is not treated with agro chemicals, plants grow at an average rate of 30% within a square meter. You may assume that the number of plants that grow in the garden may be modelled by a Poisson distribution. Mr Amankwah Amaniapong has a rectangular garden measuring seven-hundred centimeters by three hundred centimeters. He uses these same
4. In a certain garden which has been treated with agro chemicals, new plants grow at an average rate of 10% within a square meter. When this same garden is not treated with agro chemicals, plants grow at an average rate of 30% within a square meter. You may assume that the number of plants that grow in the garden may be modelled by a Poisson distribution. Mr Amankwah Amaniapong has a rectangular garden measuring seven-hundred centimeters by three hundred centimeters. He uses these same

Holt Mcdougal Larson Pre-algebra: Student Edition 2012
1st Edition
ISBN:9780547587776
Author:HOLT MCDOUGAL
Publisher:HOLT MCDOUGAL
Chapter11: Data Analysis And Probability
Section11.4: Collecting Data
Problem 2E

Related questions
Question
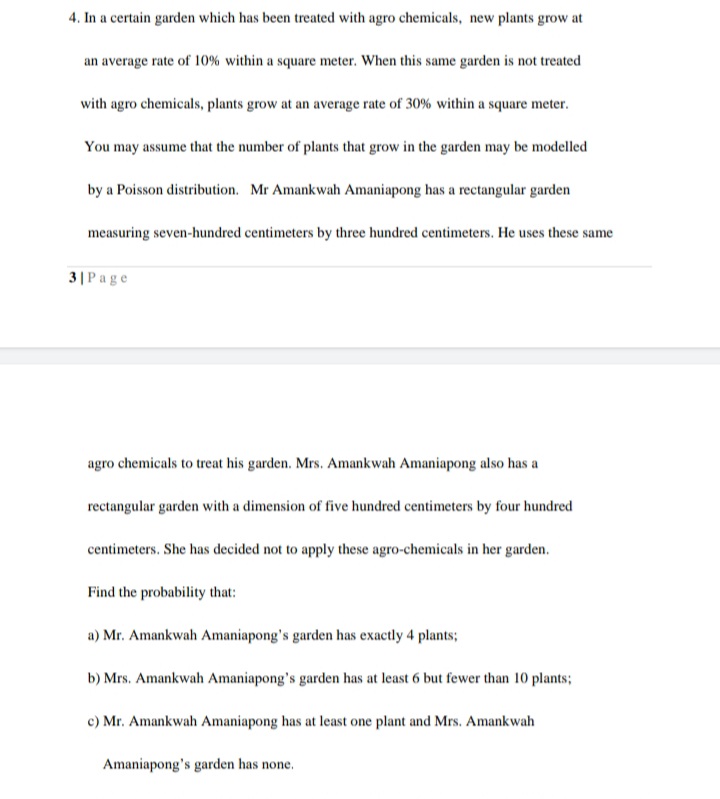
Transcribed Image Text:4. In a certain garden which has been treated with agro chemicals, new plants grow at
an average rate of 10% within a square meter. When this same garden is not treated
with agro chemicals, plants grow at an average rate of 30% within a square meter.
You may assume that the number of plants that grow in the garden may be modelled
by a Poisson distribution. Mr Amankwah Amaniapong has a rectangular garden
measuring seven-hundred centimeters by three hundred centimeters. He uses these same
3|Page
agro chemicals to treat his garden. Mrs. Amankwah Amaniapong also has a
rectangular garden with a dimension of five hundred centimeters by four hundred
centimeters. She has decided not to apply these agro-chemicals in her garden.
Find the probability that:
a) Mr. Amankwah Amaniapong's garden has exactly 4 plants;
b) Mrs. Amankwah Amaniapong's garden has at least 6 but fewer than 10 plants;
c) Mr. Amankwah Amaniapong has at least one plant and Mrs. Amankwah
Amaniapong's garden has none.
Expert Solution
This question has been solved!
Explore an expertly crafted, step-by-step solution for a thorough understanding of key concepts.

Step by step
Solved in 2 steps

Recommended textbooks for you
Holt Mcdougal Larson Pre-algebra: Student Edition…
Algebra
ISBN:
9780547587776
Author:
HOLT MCDOUGAL
Publisher:
HOLT MCDOUGAL
Holt Mcdougal Larson Pre-algebra: Student Edition…
Algebra
ISBN:
9780547587776
Author:
HOLT MCDOUGAL
Publisher:
HOLT MCDOUGAL