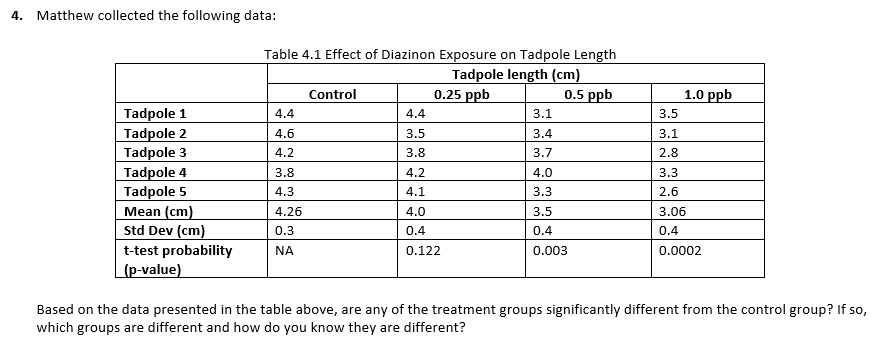
4. Matthew collected the following data: Tadpole 1 Tadpole 2 Tadpole 3 Tadpole 4 Tadpole 5 Mean (cm) Std Dev (cm) t-test probability (p-value) Table 4.1 Effect of Diazinon Exposure on Tadpole Length Tadpole length (cm) 0.25 ppb 0.5 ppb 4.4 4.6 4.2 3.8 4.3 4.26 0.3 ΝΑ Control 4.4 3.5 3.8 4.2 4.1 4.0 0.4 0.122 3.1 3.4 3.7 4.0 3.3 3.5 0.4 0.003 1.0 ppb 3.5 3.1 2.8 3.3 2.6 3.06 0.4 0.0002 Based on the data presented in the table above, are any of the treatment groups significantly different from the control group? If so, which groups are different and how do you know they are different?
4. Matthew collected the following data: Tadpole 1 Tadpole 2 Tadpole 3 Tadpole 4 Tadpole 5 Mean (cm) Std Dev (cm) t-test probability (p-value) Table 4.1 Effect of Diazinon Exposure on Tadpole Length Tadpole length (cm) 0.25 ppb 0.5 ppb 4.4 4.6 4.2 3.8 4.3 4.26 0.3 ΝΑ Control 4.4 3.5 3.8 4.2 4.1 4.0 0.4 0.122 3.1 3.4 3.7 4.0 3.3 3.5 0.4 0.003 1.0 ppb 3.5 3.1 2.8 3.3 2.6 3.06 0.4 0.0002 Based on the data presented in the table above, are any of the treatment groups significantly different from the control group? If so, which groups are different and how do you know they are different?

Glencoe Algebra 1, Student Edition, 9780079039897, 0079039898, 2018
18th Edition
ISBN:9780079039897
Author:Carter
Publisher:Carter
Chapter10: Statistics
Section10.4: Distributions Of Data
Problem 19PFA

Related questions
Question
Transcribed Image Text:4. Matthew collected the following data:
Tadpole 1
Tadpole 2
Tadpole 3
Tadpole 4
Tadpole 5
Mean (cm)
Std Dev (cm)
t-test probability
(p-value)
Table 4.1 Effect of Diazinon Exposure on Tadpole Length
Tadpole length (cm)
0.25 ppb
0.5 ppb
4.4
4.6
4.2
3.8
4.3
4.26
0.3
ΝΑ
Control
4.4
3.5
3.8
4.2
4.1
4.0
0.4
0.122
3.1
3.4
3.7
4.0
3.3
3.5
0.4
0.003
1.0 ppb
3.5
3.1
2.8
3.3
2.6
3.06
0.4
0.0002
Based on the data presented in the table above, are any of the treatment groups significantly different from the control group? If so,
which groups are different and how do you know they are different?
Expert Solution
This question has been solved!
Explore an expertly crafted, step-by-step solution for a thorough understanding of key concepts.

This is a popular solution!

Trending now
This is a popular solution!

Step by step
Solved in 3 steps with 2 images

Recommended textbooks for you
Glencoe Algebra 1, Student Edition, 9780079039897…
Algebra
ISBN:
9780079039897
Author:
Carter
Publisher:
McGraw Hill
Glencoe Algebra 1, Student Edition, 9780079039897…
Algebra
ISBN:
9780079039897
Author:
Carter
Publisher:
McGraw Hill