The following table shows the number of hours some middle school students in two cities spend texting each week: City A9 27 17 24 21 12 25 25 18 City B 6 20 26 15 23 25 14 14 11 Part A: Create a five-number summary and calculate the interquartile range for the two sets of data. ( Part B: Are the box plots symmetric? Justify your answer. (
The following table shows the number of hours some middle school students in two cities spend texting each week: City A9 27 17 24 21 12 25 25 18 City B 6 20 26 15 23 25 14 14 11 Part A: Create a five-number summary and calculate the interquartile range for the two sets of data. ( Part B: Are the box plots symmetric? Justify your answer. (

Holt Mcdougal Larson Pre-algebra: Student Edition 2012
1st Edition
ISBN:9780547587776
Author:HOLT MCDOUGAL
Publisher:HOLT MCDOUGAL
Chapter11: Data Analysis And Probability
Section11.1: Stem-and-leaf Plots And Histograms
Problem 9E

Related questions
Question
PLEASE SOLVE IT COMPLETELY AND ACCURATLY.
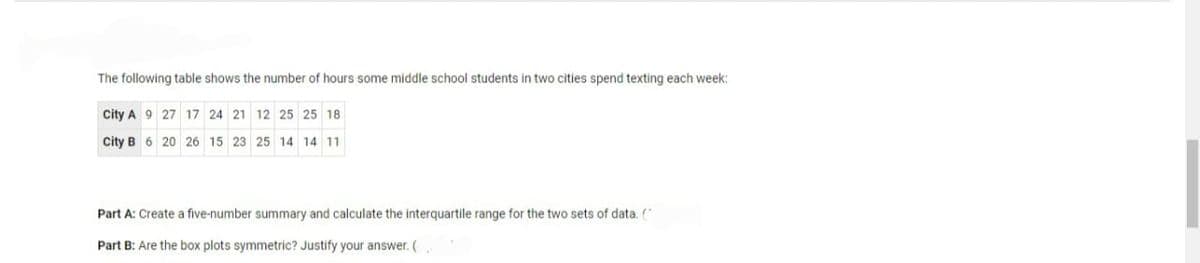
Transcribed Image Text:The following table shows the number of hours some middle school students in two cities spend texting each week:
City A 9 27 17 24 21 12 25 25 18
City B 6 20 26 15 23
25 14 14 11
Part A: Create a five-number summary and calculate the interquartile range for the two sets of data. ("
Part B: Are the box plots symmetric? Justify your answer. (
Expert Solution
This question has been solved!
Explore an expertly crafted, step-by-step solution for a thorough understanding of key concepts.

This is a popular solution!

Trending now
This is a popular solution!

Step by step
Solved in 4 steps with 9 images

Recommended textbooks for you
Holt Mcdougal Larson Pre-algebra: Student Edition…
Algebra
ISBN:
9780547587776
Author:
HOLT MCDOUGAL
Publisher:
HOLT MCDOUGAL

Functions and Change: A Modeling Approach to Coll…
Algebra
ISBN:
9781337111348
Author:
Bruce Crauder, Benny Evans, Alan Noell
Publisher:
Cengage Learning
Holt Mcdougal Larson Pre-algebra: Student Edition…
Algebra
ISBN:
9780547587776
Author:
HOLT MCDOUGAL
Publisher:
HOLT MCDOUGAL
Functions and Change: A Modeling Approach to Coll…
Algebra
ISBN:
9781337111348
Author:
Bruce Crauder, Benny Evans, Alan Noell
Publisher:
Cengage Learning