The ages (in years) of a random sample of shoppers at a gaming store are shown. Determine the range, mean, variance, and standard deviation of the sample data set. 12, 21, 23, 15, 20, 18, 21, 16, 15, 16
The ages (in years) of a random sample of shoppers at a gaming store are shown. Determine the range, mean, variance, and standard deviation of the sample data set. 12, 21, 23, 15, 20, 18, 21, 16, 15, 16

Glencoe Algebra 1, Student Edition, 9780079039897, 0079039898, 2018
18th Edition
ISBN:9780079039897
Author:Carter
Publisher:Carter
Chapter10: Statistics
Section: Chapter Questions
Problem 19SGR

Related questions
Question
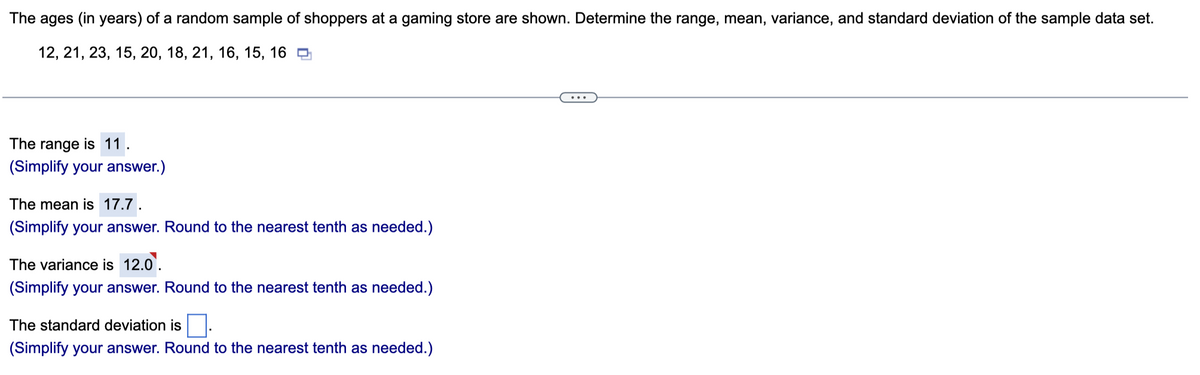
Transcribed Image Text:The ages (in years) of a random sample of shoppers at a gaming store are shown. Determine the range, mean, variance, and standard deviation of the sample data set.
12, 21, 23, 15, 20, 18, 21, 16, 15, 16
The range is 11.
(Simplify your answer.)
The mean is 17.7.
(Simplify your answer. Round to the nearest tenth as needed.)
The variance is 12.0.
(Simplify your answer. Round to the nearest tenth as needed.)
The standard deviation is
(Simplify your answer. Round to the nearest tenth as needed.)
Expert Solution
This question has been solved!
Explore an expertly crafted, step-by-step solution for a thorough understanding of key concepts.

This is a popular solution!

Trending now
This is a popular solution!

Step by step
Solved in 6 steps with 4 images

Recommended textbooks for you
Glencoe Algebra 1, Student Edition, 9780079039897…
Algebra
ISBN:
9780079039897
Author:
Carter
Publisher:
McGraw Hill
Glencoe Algebra 1, Student Edition, 9780079039897…
Algebra
ISBN:
9780079039897
Author:
Carter
Publisher:
McGraw Hill