4. obtain follows Poobability of each class os $(zim)-$(zi) For last class 1-(zi)
Q: DI HAND UR EXCEL FILE. The life expectancy in the United States is 75 with a standard deviation of 7…
A: GivenMean(μ)=75standard deviation(σ)=7sample size(n)=49
Q: 14. The following probability model shows the number of cars owned by American households, along…
A: We have given that, Number of cars owned (X) 0 1 2 3 4 5 6 or more Probability P(X) 0.09…
Q: Question 2 In 2007 the US Census Bureau reported that 71.3% of American families ow homes. The city…
A: Concept: Type I error is the probability of rejecting the null hypothesis when it is actually true.…
Q: EXAMPLE :- How many 3 digits number can be formed using digits 1,6,8,9,3,7 without repeating any…
A: From the provided information, The digits are 1, 6, 8, 9, 3, 7 Total digits = 6
Q: Example 18.16) The sales of a company (in lakh of Rs) for the seven years are given below: Year 1990…
A:
Q: Assume Springfield house prices are Normally distributed with a mean of $415,000 and standard…
A:
Q: The least-squares regression output reports the p-value for a two-sided hypothesis test. True False
A: In this case, we need to check whether the given statement is true or false.
Q: According to a recent report, 12% of all adults eat pizza with a knife and fork. A researcher…
A: Population proportion is given as 12%
Q: In sampling without replacement from a population of 900, it's found that the standard error of the…
A:
Q: 5. It is claimed that the proportion of high school athletes who go on to play sports in college is…
A: Given,sample proportion(p^)=0.07population proportion(P)=0.08P-value=0.06α=0.05
Q: Ex: The following data represent the number of damaged pieces of spare parts for the production of a…
A: We have given the following data for the production of a company and the probability distribution…
Q: P(z) 0.3 1 0.3 2 0.15 3 0.25 Find the mean of this probability distribution. Round your answer to…
A:
Q: For least-squares to work well, we need: the relationship between x and y to be non-linear.…
A: We have given the following statement about the least square.
Q: Determine the critical values that would be used in testing each of the following null hypotheses…
A:
Q: The table to the right gives the number of passenger car occupants killed in accidents in a certain…
A: Formula used for relative frequency. Relative frequency = frequency/total number of frequency.
Q: What kind of hypothesis is illustrated in statement below? “There is no significant difference…
A: Here There is no significant difference between the average weekly allowances of morning and…
Q: The following data represents the body temperature in degrees Fahrenheit of randomly selected…
A: The number of observations is 21.
Q: . A wildlife researcher is interested in predicting an alligator’s weight (in pounds) based on its…
A:
Q: Find the indicated z-score shown in the graph to the right.
A: From the given plot, The area is P(Z<z)=0.3745.
Q: 1. For a 95% confidence level, what are the critical values fora one-tailed test? 2. For a 99%…
A: Given that 95% confidence level and 99% confidence level.
Q: Use the following computer data, which refers to bear measurements, to answer the question.…
A: From the output, The value of R^2 is 0.969. The adj value of R^2 is 0.946.
Q: Which of the following data sets could most appropriately be analyzed with a simple linear…
A: We have given the following graphs.
Q: You want to estimate the proportion of all college students who traveled during spring break. You…
A: Bhnjhhh
Q: Researchers interested in lead exposure due to car exhaust sampled the blood of 52 police officers…
A: Disclaimer: Since you have posted a question with multiple sub-parts, we will solve the first three…
Q: Q2/ The follOwing data represent the sales of a private company for the period 2005-2010 Answer each…
A: Given: Year Sales 2009 7 2008 10 2007 13 2006 14 2005 18 2010 20
Q: A dietician is researching two new weight gain supplements that have just hit the market: Ripped and…
A:
Q: 17. When the heights (in inches) and shoe lengths (also in inches) were measured for a large random…
A: 1. Variability Explained R^2= (r)^2 = (0.89)^2 0.7921 i.e 79.21 % variability is…
Q: inning team data were collected for teams in different sports, with the results given in the…
A: The null and alternative hypotheses are: H0: The home/visitor win is independent of the sport. H1:…
Q: only, explain which of the following forecasting method would you recommend: the Naïve method, the…
A: Naive method : In this method last period sales is used for the next period forecast without…
Q: (10) Find the indicated probability. As a prize for winning a contest, the contestant is blindfolded…
A:
Q: What was the cutoff for a failing score? Approximately what percentage of the students failed?
A: The scores on a psychology exam were normally distributed with a mean of 68 and a standard deviation…
Q: The frequency distribution for the values of resistance in ohms of 48 resistors is as shown. Find…
A: Given data is Class Frequency 20.5 - 20.9 3 21.0 - 21.4 10 21.5 - 21.9 11 22.0 - 22.4 13…
Q: Suppose a pair of dice is rolled 1- What is the probability that both dice turn up the same ? 2-…
A:
Q: the probabilities that it will take on a value: a) Greater than 16.5 b) Less than 15 c) Between 13.5…
A: Let X be the random variable from normal distribution with mean (μ) = 16, variance (σ2) = 1.5625…
Q: to to
A: There are many test to check whether the data is normally distributed or not but here we are going…
Q: A normal distribution has ? = 31 and ? = 4. (a) Find the z score corresponding to x = 27. (b)…
A: The provided information is µ=31 σ=4 a. when x=27 z=x-µσz=27-314z=-1 The z score is -1
Q: A study performed in 1984 examined the relationship between the price of gasoline in Great Britain…
A: Regression equation is explains the predicted value over the changes in time. It has two regressor…
Q: A manufacturer wanted to know if more coupons would be redeemed if they were mailed to the female in…
A: From the provided information, Sample size (n) = 50 Mean difference (x̄d) = 1.5 Standard deviation…
Q: Use the following computer data, which refers to bear measurements, to answer the question.…
A: We need to find the adjusted value of the multiple coefficient of determination R2 .
Q: Q 4/ After collecting considerable data, the engineers decided to model the variation in shaft…
A: Let X be the random variable from normal distribution with mean (μ) = 10.1 and standard deviation…
Q: Draw and fully label a figure illustrating how an insurance company could induce low-risk and…
A:
Q: (a) Consider a t distribution with 24 degrees of freedom. Compute P(-1.00<1<1.00). Round your answer…
A:
Q: Test the claim that the mean GPA of night students is larger than 3.1 at the .025 significance…
A: Given Sample mean x̄=3.15, n=55, sample standard deviations s=0.03 , level of significance ɑ=0.025…
Q: Q1. The test scores ona test were recorded for 8 students as follows: 71, 93, 91, 86, 75, 73, 86, 82…
A:
Q: A survey of 97 random homeowners in my neighborhood had a mean of $720 spent on lawn care. Construct…
A:
Q: Suppose the heights of women at a college are approximately Normally distributed with a mean of 64…
A: Given that the heights of women at a college are approximately Normally distributed with a mean of…
Q: Consider the following set of data. (22, 8), (31, 48), (61, 34), (79, 24), (107, 61), (116, 14)…
A: Given that X Y X \cdot YX⋅Y X^2X2 Y^2Y2 22 8 176 484 64 31 48 1488 961 2304 61 34…
Q: A simple clinical trial was performed to compare two medicines. A total of 20 patients were…
A: From the provided information, Sample size (n1) = 10 and n2 = 10
Q: A study reported the results of a randomized trial of whole-body hypothermia (cooling) for neonatal…
A: Givenx1=29n1=99Hypothermia treatment group:-p1^=x1n1=2999=0.2929Control…
Q: A construction company is considering jubmitting bids for two contracts. It will cost the company…
A:
Can you explain in more detail how the
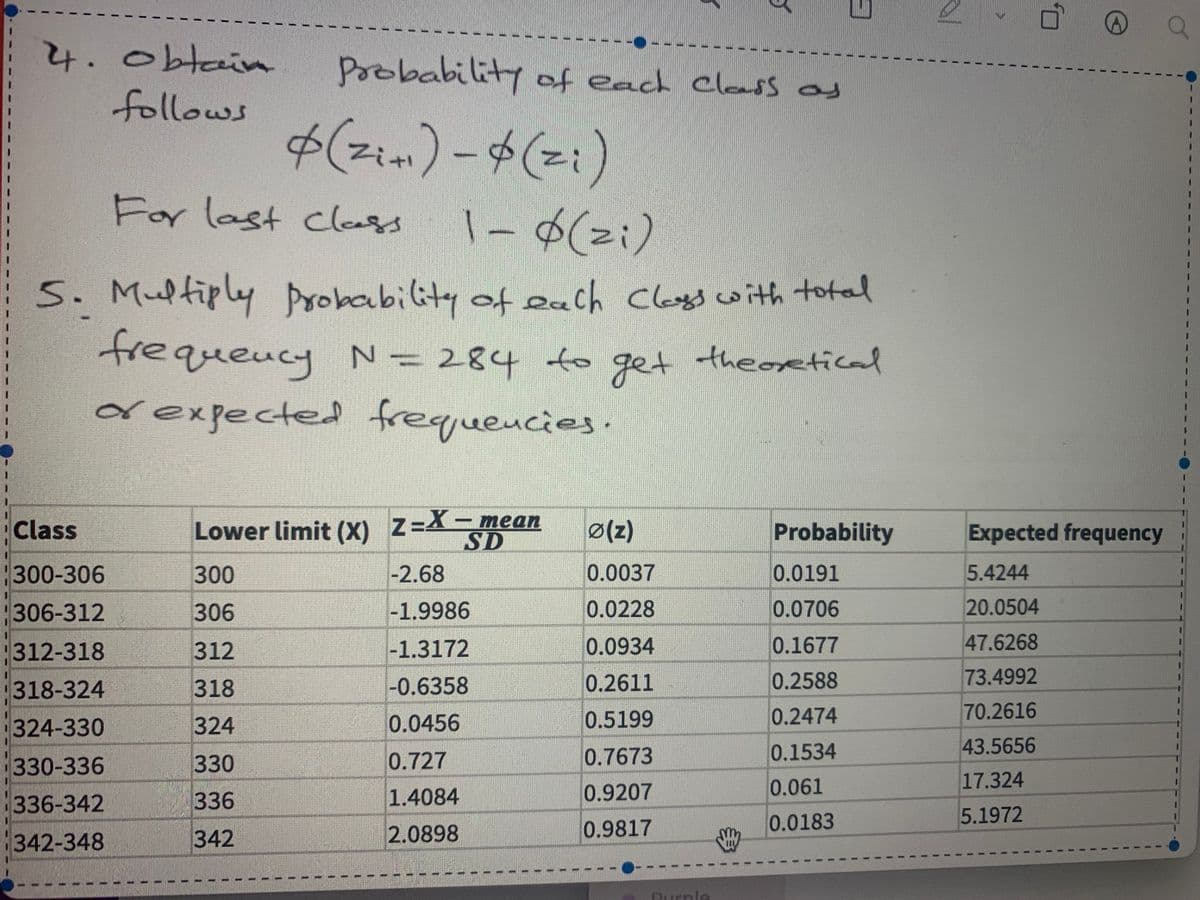
Step by step
Solved in 2 steps
- The manufacturer of large liquid crystal display (LCD) is difficult. Some defectsare minor and can be removed; others are unremovable. The number of unremovabledefects for each of n = 45 displays1 0 5 3 0 7 6 0 0 4 6 85 0 9 1 0 8 6 0 3 2 0 00 6 0 10 0 6 0 0 1 0 0 00 1 5 1 0 5 0 0 2has mean ̅ x= 2.667 and s = 3.057 unremovable defects. Conduct a test of hypothesis withthe intent of showing that the mean number of unremovable defects is less than 3.6. Take α= 0.025.Which of the following is NOT a condition that ALWAYS has to be satisfied to apply the Central Limit Theorem to the sample mean? a) The sample size must be larger than 30 b) There are no obvious outliers in the sample if the sample size is less than 30 c) There are no extreme outliers in the sample if the sample size is at least 30. d) The sample observations are independent.Which of the following are specified by the central limit theorem? a. the mean of a specific sample from the distribution of sample means b. the mean of the distribution of sample means c. the shape of the distribution of sample means d. the variability for the distribution of sample means
- The target fill weight for a box of cereal is 350 g. Each day a sample of 300 boxes is taken, and the number that are underweight is counted. The number of underweight boxes for each of the last 25 days is as follows: 23121919201921272623262225 303022252729353943413929 a) Compute the upper and lower 3σ limits for a p chart. b) Is the process in control? If not, when is it first detected to be out of control?they take samples of 4 fireworks for quality co from and examine them for defects. let X be the number of defective fireworks in the sample of 4.Which of the following statements about the Central Limit Theorem (CLT) is correct?1. The CLT states that the sample mean is always equal to the population mean.2. The CLT states that the sampling distribution of the sample mean is approximately normal for large sample sizes (n > 30).3. The CLT states that the sample mean is equal to the population mean, provided that n > 30.4. The CLT states that the sampling distribution of the population mean is approximately normal, provided that n > 30. In a distribution plot, if the mean is equal to the median, is the possible shape of the distribution skewed to the right, skewed to the left, or symmetric? If batteries have lives that are normally distribute with mean 2, 800 hours and standard deviation 400 hours, using the 68-95-99.7 rule to approximate the percentage of batteries having a life less than 3, 600 hours.
- A crazy statistics tutor only passes 10% of students in a university subject, by examining all students in foreign languages that they do not know. If 20 students are randomly assigned to this tutor, what is the probability that at most 1 student passes in the tutorial group? A) 0.392 B) 0.270 C) 0.0 because their mark is a continuous rendom veritable D)0.122The central limit theorem tells us (select all that apply ) - that the population of a sample means an be regarded as normal no matter what the sample size is - that as long as the sample size is greater than 30, the parent population can be assumed about normal -that as long as the sample size is greater than 30, the distribution of the sample means is about normal -that no matter what the parent population looks like the distribution of the sample means can be assumed to be normalSuppose that n observations are chosen at random from a continuous pdf fY(y). What is the probability that the last observation recorded will be the smallest number in the sample? I asked this question earlier today, but didn't quite understand all of the response. P(y1<=yn)p(y2<=yn) and so on was used, but shouldn't the yn be listed first in the inequality since we want to know if yn is the smallest?
- Consider a birth and death process, X = {X(t)} : t ≥ 0 with the 4 states, S = {0, 1, 2, 3} and instant rates per hour are specified implicitly as follows: 1 /λk = 10 minutes for (0 ≤ k ≤ 2) and 1/ µk = 30 minutes for (1 ≤ k ≤ 3) Assume that λk = 0 for k ≥ 3 and µk = 0 for k > 3. a) Derive the limiting distribution, lim t→ ∞ P [X(t) = k] for all k b) Evaluate expectations in minutes for departure times, E [S1 |X(0) = 0] and E [S3 |X(0) = 3]Suppose an interval has frequency f . If the class interval with the lowest value is at the lowest row, then _________ is the sum of frequency f and all frequencies below it. greater than cumulative frequency Relative frequency less than cumulative frequency class markAccording to the Central Limit Theorem, the distribution of sample means is NOT normal if _________________. A) The population from which the samples are selected is not normally distributed and the sample size is small (n < 30). B) The population from which the samples are selected is not normally distributed and the sample size is large (n >= 30). C) The population from which the samples are selected is normally distributed and the sample size is small (n < 30). D) The population from which the samples are selected is normally distributed and the sample size is large (n >= 30).