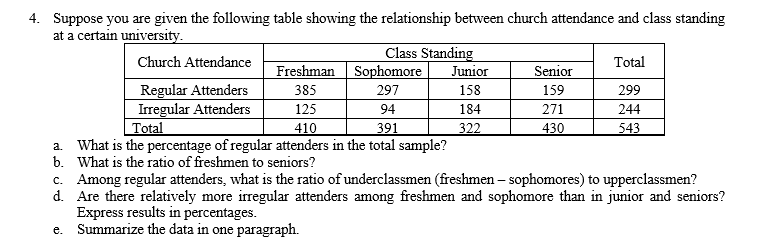
4. Suppose you are given the following table showing the relationship between church attendance and class standing at a certain university. Class Standing Sophomore 297 Church Attendance Total Freshman Junior Senior 159 Regular Attenders Iregular Attenders Total 385 158 299 125 94 184 271 244 410 391 322 430 543 a What is the percentage of regular attenders in the total sample? b. What is the ratio of freshmen to seniors? c. Among regular attenders, what is the ratio of underclassmen (freshmen – sophomores) to upperclassmen? d. Are there relatively more irregular attenders among freshmen and sophomore than in junior and seniors? Express results in percentages. e. Summarize the data in one paragraph.
4. Suppose you are given the following table showing the relationship between church attendance and class standing at a certain university. Class Standing Sophomore 297 Church Attendance Total Freshman Junior Senior 159 Regular Attenders Iregular Attenders Total 385 158 299 125 94 184 271 244 410 391 322 430 543 a What is the percentage of regular attenders in the total sample? b. What is the ratio of freshmen to seniors? c. Among regular attenders, what is the ratio of underclassmen (freshmen – sophomores) to upperclassmen? d. Are there relatively more irregular attenders among freshmen and sophomore than in junior and seniors? Express results in percentages. e. Summarize the data in one paragraph.

Glencoe Algebra 1, Student Edition, 9780079039897, 0079039898, 2018
18th Edition
ISBN:9780079039897
Author:Carter
Publisher:Carter
Chapter4: Equations Of Linear Functions
Section: Chapter Questions
Problem 8SGR

Related questions
Question
Transcribed Image Text:4. Suppose you are given the following table showing the relationship between church attendance and class standing
at a certain university.
Class Standing
Sophomore
Junior
Church Attendance
Total
Freshman
Senior
Regular Attenders
Irregular Attenders
Total
385
297
158
159
299
125
94
184
271
244
410
391
322
430
543
a. What is the percentage of regular attenders in the total sample?
b. What is the ratio of freshmen to seniors?
c. Among regular attenders, what is the ratio of underclassmen (freshmen – sophomores) to upperclassmen?
d. Are there relatively more irregular attenders among freshmen and sophomore than in junior and seniors?
Express results in percentages.
e. Summarize the data in one paragraph.
Expert Solution
This question has been solved!
Explore an expertly crafted, step-by-step solution for a thorough understanding of key concepts.

This is a popular solution!

Trending now
This is a popular solution!

Step by step
Solved in 4 steps with 6 images

Recommended textbooks for you
Glencoe Algebra 1, Student Edition, 9780079039897…
Algebra
ISBN:
9780079039897
Author:
Carter
Publisher:
McGraw Hill
Glencoe Algebra 1, Student Edition, 9780079039897…
Algebra
ISBN:
9780079039897
Author:
Carter
Publisher:
McGraw Hill