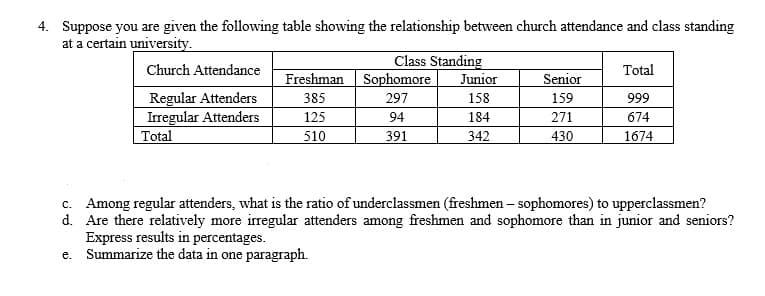
4. Suppose you are given the following table showing the relationship between church attendance and class standing at a certain university. Class Standing Junior Church Attendance Total Freshman| Sophomore Senior Regular Attenders Irregular Attenders |Total 385 297 158 159 999 125 94 184 271 674 510 391 342 430 1674 c. Among regular attenders, what is the ratio of underclassmen (freshmen- sophomores) to upperclassmen? d. Are there relatively more irregular attenders among freshmen and sophomore than in junior and seniors? Express results in percentages. e. Summarize the data in one paragraph.
4. Suppose you are given the following table showing the relationship between church attendance and class standing at a certain university. Class Standing Junior Church Attendance Total Freshman| Sophomore Senior Regular Attenders Irregular Attenders |Total 385 297 158 159 999 125 94 184 271 674 510 391 342 430 1674 c. Among regular attenders, what is the ratio of underclassmen (freshmen- sophomores) to upperclassmen? d. Are there relatively more irregular attenders among freshmen and sophomore than in junior and seniors? Express results in percentages. e. Summarize the data in one paragraph.

MATLAB: An Introduction with Applications
6th Edition
ISBN:9781119256830
Author:Amos Gilat
Publisher:Amos Gilat
Chapter1: Starting With Matlab
Section: Chapter Questions
Problem 1P

Related questions
Question
100%
Hello! Please show the solution, thank you! :)
Transcribed Image Text:4. Suppose you are given the following table showing the relationship between church attendance and class standing
at a certain university.
Class Standing
Sophomore
Church Attendance
Total
Freshman
Junior
Senior
Regular Attenders
Irregular Attenders
Total
385
297
158
159
999
125
94
184
271
674
510
391
342
430
1674
c. Among regular attenders, what is the ratio of underclassmen (freshmen – sophomores) to upperclassmen?
d. Are there relatively more irregular attenders among freshmen and sophomore than in junior and seniors?
Express results in percentages.
e. Summarize the data in one paragraph.
Expert Solution
This question has been solved!
Explore an expertly crafted, step-by-step solution for a thorough understanding of key concepts.

This is a popular solution!

Trending now
This is a popular solution!

Step by step
Solved in 4 steps

Recommended textbooks for you
MATLAB: An Introduction with Applications
Statistics
ISBN:
9781119256830
Author:
Amos Gilat
Publisher:
John Wiley & Sons Inc

Probability and Statistics for Engineering and th…
Statistics
ISBN:
9781305251809
Author:
Jay L. Devore
Publisher:
Cengage Learning

Statistics for The Behavioral Sciences (MindTap C…
Statistics
ISBN:
9781305504912
Author:
Frederick J Gravetter, Larry B. Wallnau
Publisher:
Cengage Learning
MATLAB: An Introduction with Applications
Statistics
ISBN:
9781119256830
Author:
Amos Gilat
Publisher:
John Wiley & Sons Inc
Probability and Statistics for Engineering and th…
Statistics
ISBN:
9781305251809
Author:
Jay L. Devore
Publisher:
Cengage Learning
Statistics for The Behavioral Sciences (MindTap C…
Statistics
ISBN:
9781305504912
Author:
Frederick J Gravetter, Larry B. Wallnau
Publisher:
Cengage Learning

Elementary Statistics: Picturing the World (7th E…
Statistics
ISBN:
9780134683416
Author:
Ron Larson, Betsy Farber
Publisher:
PEARSON

The Basic Practice of Statistics
Statistics
ISBN:
9781319042578
Author:
David S. Moore, William I. Notz, Michael A. Fligner
Publisher:
W. H. Freeman

Introduction to the Practice of Statistics
Statistics
ISBN:
9781319013387
Author:
David S. Moore, George P. McCabe, Bruce A. Craig
Publisher:
W. H. Freeman