The International League of Triple-A minor league baseball consists of 14 teams organized into three divisions: North, South, and West. Suppose the following data show the average attendance for the 14 teams in the International League. Also shown are the teams' records; W denotes the number of games won, L denotes the number of games lost, and PCT is the proportion of games played that were won. Team Name Division w L PCT Attendance Buffalo Bisons North 66 77 0.462 8,812 Lehigh Valley IronPigs North 55 89 0.382 8,476 Pawtucket Red Sox North 85 58 0.594 9,091 Rochester Red Wings North 74 70 0.514 6,917 Scranton-Wilkes Barre Yankees North 88 56 0.611 7,142 Syracuse Chiefs North 69 73 0.486 5,769 Charlotte Knights South 63 78 0.447 4,527 Durham Bulls South 74 70 0.514 6,993
The International League of Triple-A minor league baseball consists of 14 teams organized into three divisions: North, South, and West. Suppose the following data show the average attendance for the 14 teams in the International League. Also shown are the teams' records; W denotes the number of games won, L denotes the number of games lost, and PCT is the proportion of games played that were won. Team Name Division w L PCT Attendance Buffalo Bisons North 66 77 0.462 8,812 Lehigh Valley IronPigs North 55 89 0.382 8,476 Pawtucket Red Sox North 85 58 0.594 9,091 Rochester Red Wings North 74 70 0.514 6,917 Scranton-Wilkes Barre Yankees North 88 56 0.611 7,142 Syracuse Chiefs North 69 73 0.486 5,769 Charlotte Knights South 63 78 0.447 4,527 Durham Bulls South 74 70 0.514 6,993

Glencoe Algebra 1, Student Edition, 9780079039897, 0079039898, 2018
18th Edition
ISBN:9780079039897
Author:Carter
Publisher:Carter
Chapter10: Statistics
Section10.6: Summarizing Categorical Data
Problem 10CYU

Related questions
Question
PART B
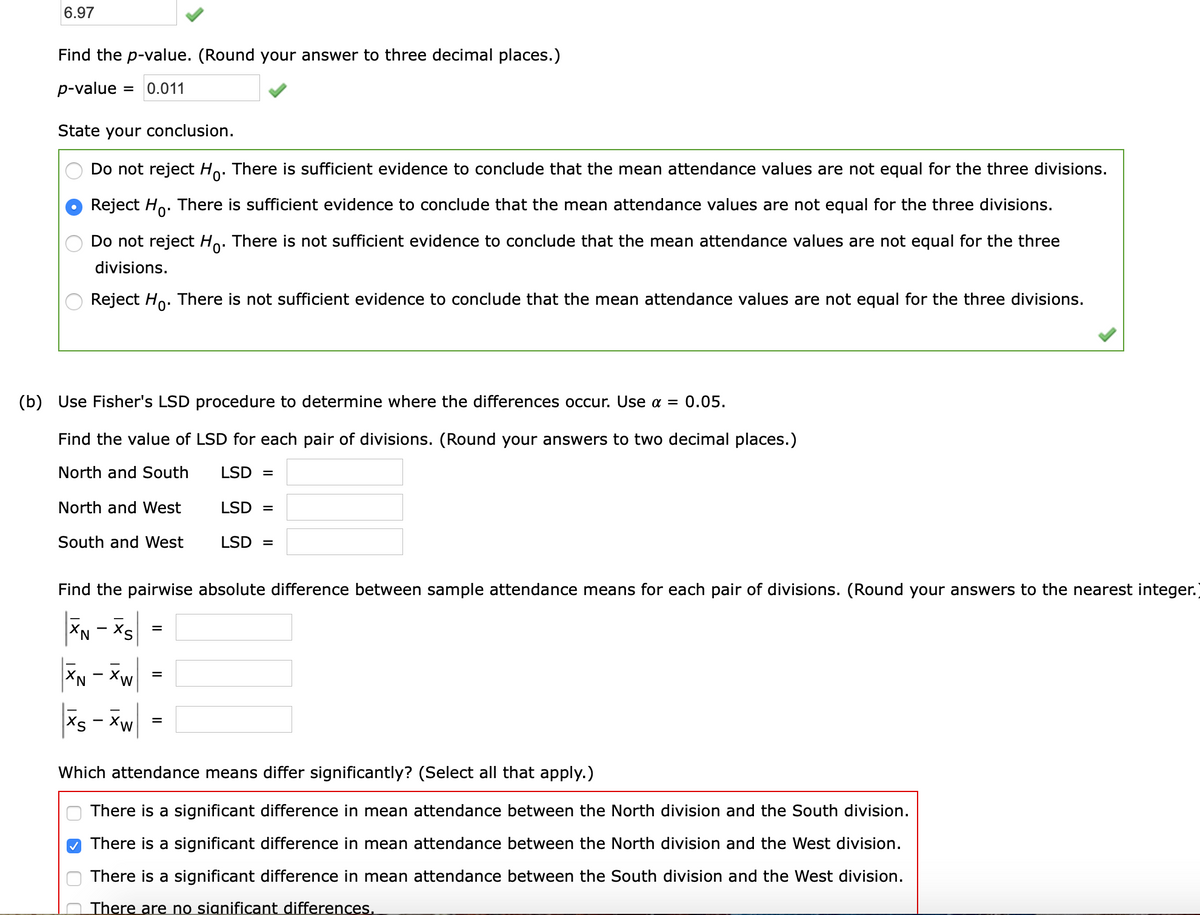
Transcribed Image Text:6.97
Find the p-value. (Round your answer to three decimal places.)
p-value
= 0.011
State your conclusion.
Do not reject Ho. There is sufficient evidence to conclude that the mean attendance values are not equal for the three divisions.
Reject Ho.
There is sufficient evidence to conclude that the mean attendance values are not equal for the three divisions.
Do not reject Ho. There is not sufficient evidence to conclude that the mean attendance values are not equal for the three
divisions.
Reject Ho. There is not sufficient evidence to conclude that the mean attendance values are not equal for the three divisions.
(b) Use Fisher's LSD procedure to determine where the differences occur. Use a = 0.05.
Find the value of LSD for each pair of divisions. (Round your answers to two decimal places.)
North and South
LSD =
North and West
LSD =
South and West
LSD =
Find the pairwise absolute difference between sample attendance means for each pair of divisions. (Round your answers to the nearest integer.)
Sx - Nx|
XN - Xw
Xs
Which attendance means differ significantly? (Select all that apply.)
There is a significant difference in mean attendance between the North division and the South division.
O There is a significant difference in mean attendance between the North division and the West division.
There is a significant difference in mean attendance between the South division and the West division.
There are no significant differences.
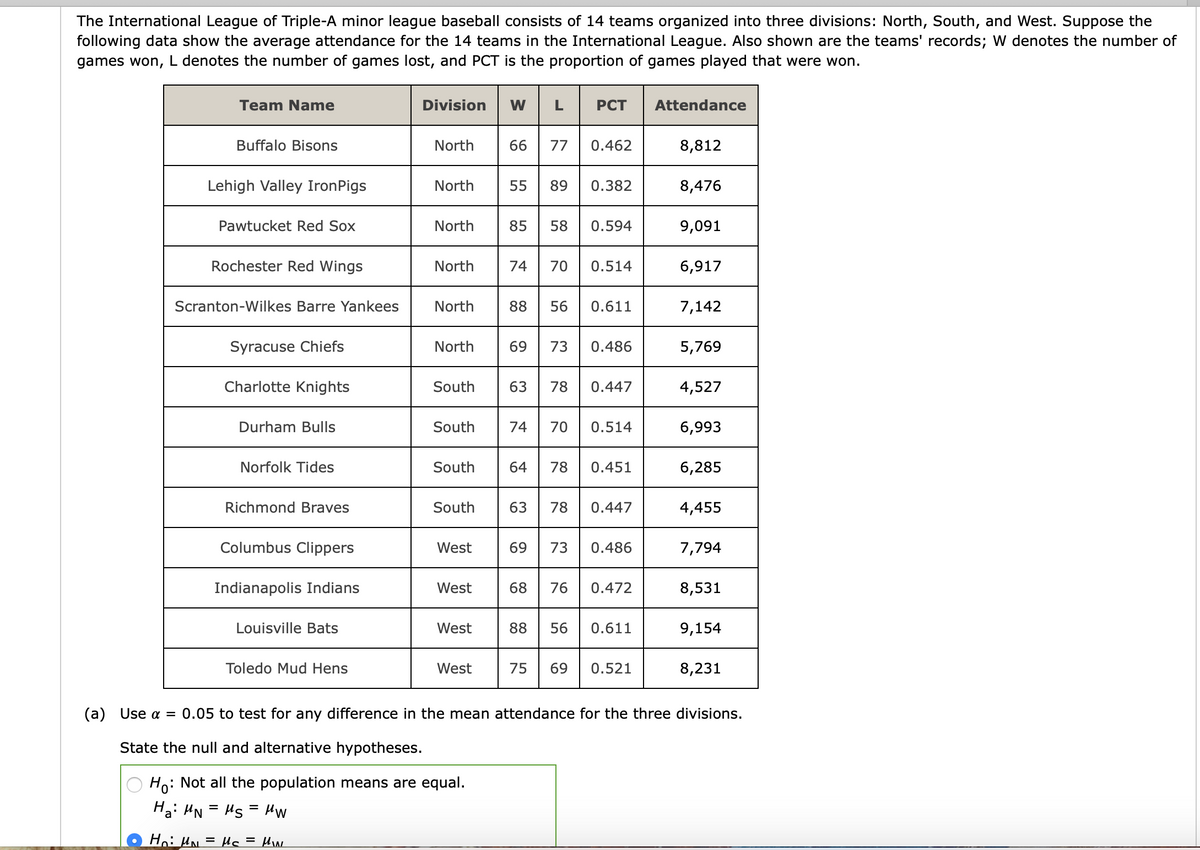
Transcribed Image Text:The International League of Triple-A minor league baseball consists of 14 teams organized into three divisions: North, South, and West. Suppose the
following data show the average attendance for the 14 teams in the International League. Also shown are the teams' records; W denotes the number of
games won, L denotes the number of games lost, and PCT is the proportion of games played that were won.
Team Name
Division
W
L
PCT
Attendance
Buffalo Bisons
North
66
77
0.462
8,812
Lehigh Valley IronPigs
North
55
89
0.382
8,476
Pawtucket Red Sox
North
85
58
0.594
9,091
Rochester Red Wings
North
74
70
0.514
6,917
Scranton-Wilkes Barre Yankees
North
88
56
0.611
7,142
Syracuse Chiefs
North
69
73
0.486
5,769
Charlotte Knights
South
63
78
0.447
4,527
Durham Bulls
South
74
70
0.514
6,993
Norfolk Tides
South
64
78
0.451
6,285
Richmond Braves
South
63
78
0.447
4,455
Columbus Clippers
West
69
73
0.486
7,794
Indianapolis Indians
West
68
76
0.472
8,531
Louisville Bats
West
88
56
0.611
9,154
Toledo Mud Hens
West
75
69
0.521
8,231
(a) Use a = 0.05 to test for any difference in the mean attendance for the three divisions.
State the null and alternative hypotheses.
: Not all the population means are equal.
Hoi
Hai HN = Hs = Hw
Ho: HN = uc = Hw
Expert Solution
This question has been solved!
Explore an expertly crafted, step-by-step solution for a thorough understanding of key concepts.

This is a popular solution!

Trending now
This is a popular solution!

Step by step
Solved in 3 steps

Knowledge Booster


Learn more about
Need a deep-dive on the concept behind this application? Look no further. Learn more about this topic, statistics and related others by exploring similar questions and additional content below.Recommended textbooks for you
Glencoe Algebra 1, Student Edition, 9780079039897…
Algebra
ISBN:
9780079039897
Author:
Carter
Publisher:
McGraw Hill

Holt Mcdougal Larson Pre-algebra: Student Edition…
Algebra
ISBN:
9780547587776
Author:
HOLT MCDOUGAL
Publisher:
HOLT MCDOUGAL

Big Ideas Math A Bridge To Success Algebra 1: Stu…
Algebra
ISBN:
9781680331141
Author:
HOUGHTON MIFFLIN HARCOURT
Publisher:
Houghton Mifflin Harcourt
Glencoe Algebra 1, Student Edition, 9780079039897…
Algebra
ISBN:
9780079039897
Author:
Carter
Publisher:
McGraw Hill
Holt Mcdougal Larson Pre-algebra: Student Edition…
Algebra
ISBN:
9780547587776
Author:
HOLT MCDOUGAL
Publisher:
HOLT MCDOUGAL
Big Ideas Math A Bridge To Success Algebra 1: Stu…
Algebra
ISBN:
9781680331141
Author:
HOUGHTON MIFFLIN HARCOURT
Publisher:
Houghton Mifflin Harcourt