4. Suppose you took a large number of random samples of size n from a large population and calculated the mean of each sample. Then suppose you plotted the distribution of your sample means in a histogram. Now consider the following possible attributes of your collected data and the population from which they were sampled. For which of the following sets of attributes would you not expect your histogram of your sample means to follow a nearly normal distribution? n=120. The population distribution is slightly skewed. n = 10. The population distribution is unknown, but the distribution of data in each sample is heavily skewed. n=120. The population distribution is unknown, but the distribution of data in each sample is slightly skewed. n=20. The population distribution is nearly normal.
4. Suppose you took a large number of random samples of size n from a large population and calculated the mean of each sample. Then suppose you plotted the distribution of your sample means in a histogram. Now consider the following possible attributes of your collected data and the population from which they were sampled. For which of the following sets of attributes would you not expect your histogram of your sample means to follow a nearly normal distribution? n=120. The population distribution is slightly skewed. n = 10. The population distribution is unknown, but the distribution of data in each sample is heavily skewed. n=120. The population distribution is unknown, but the distribution of data in each sample is slightly skewed. n=20. The population distribution is nearly normal.

Glencoe Algebra 1, Student Edition, 9780079039897, 0079039898, 2018
18th Edition
ISBN:9780079039897
Author:Carter
Publisher:Carter
Chapter10: Statistics
Section10.4: Distributions Of Data
Problem 19PFA

Related questions
Question
show complete solution
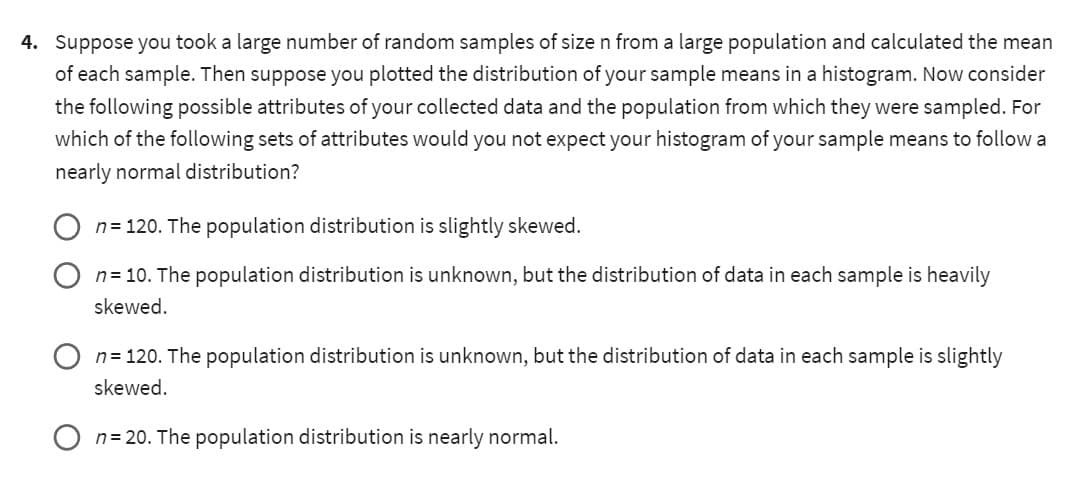
Transcribed Image Text:4. Suppose you took a large number of random samples of size n from a large population and calculated the mean
of each sample. Then suppose you plotted the distribution of your sample means in a histogram. Now consider
the following possible attributes of your collected data and the population from which they were sampled. For
which of the following sets of attributes would you not expect your histogram of your sample means to follow a
nearly normal distribution?
n=120. The population distribution is slightly skewed.
n = 10. The population distribution is unknown, but the distribution of data in each sample is heavily
skewed.
n=120. The population distribution is unknown, but the distribution of data in each sample is slightly
skewed.
n=20. The population distribution is nearly normal.
Expert Solution
This question has been solved!
Explore an expertly crafted, step-by-step solution for a thorough understanding of key concepts.

Step by step
Solved in 2 steps

Recommended textbooks for you
Glencoe Algebra 1, Student Edition, 9780079039897…
Algebra
ISBN:
9780079039897
Author:
Carter
Publisher:
McGraw Hill
Glencoe Algebra 1, Student Edition, 9780079039897…
Algebra
ISBN:
9780079039897
Author:
Carter
Publisher:
McGraw Hill