4. The following data represents the time taken to complete a race for 5 first and 7 final year athletes. Both samples were taken from normal populations. year athlete W Times in minutes First 90 145 195 180 99 year Final 98 82 120 88 150 66 101 Year a. Compute the 90% confidence interval for the difference in mean time taken to complete the race for the two groups of athletes.
4. The following data represents the time taken to complete a race for 5 first and 7 final year athletes. Both samples were taken from normal populations. year athlete W Times in minutes First 90 145 195 180 99 year Final 98 82 120 88 150 66 101 Year a. Compute the 90% confidence interval for the difference in mean time taken to complete the race for the two groups of athletes.

Glencoe Algebra 1, Student Edition, 9780079039897, 0079039898, 2018
18th Edition
ISBN:9780079039897
Author:Carter
Publisher:Carter
Chapter10: Statistics
Section10.4: Distributions Of Data
Problem 19PFA

Related questions
Question
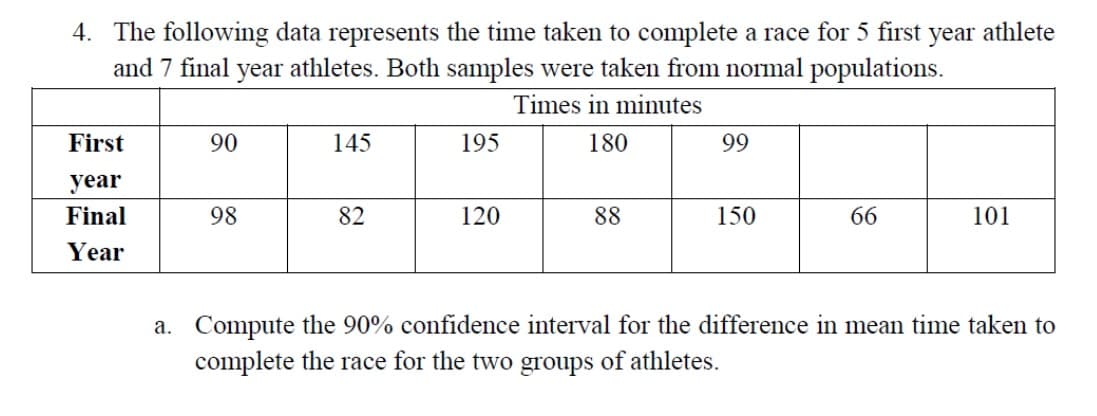
Transcribed Image Text:4. The following data represents the time taken to complete a race for 5 first
and 7 final year athletes. Both samples were taken from normal populations.
year
athlete
Times in minutes
First
90
145
195
180
99
year
Final
98
82
120
88
150
66
101
Year
a. Compute the 90% confidence interval for the difference in mean time taken to
complete the race for the two groups of athletes.
Expert Solution
This question has been solved!
Explore an expertly crafted, step-by-step solution for a thorough understanding of key concepts.

Step by step
Solved in 2 steps

Recommended textbooks for you
Glencoe Algebra 1, Student Edition, 9780079039897…
Algebra
ISBN:
9780079039897
Author:
Carter
Publisher:
McGraw Hill
Glencoe Algebra 1, Student Edition, 9780079039897…
Algebra
ISBN:
9780079039897
Author:
Carter
Publisher:
McGraw Hill