4. This pie chart shows how Tamara's time passed on Saturday. Homework Housework 6 hours What fraction of Tamara's time was spent Reading 4 hours doing homework? 10 hours Sieeping
4. This pie chart shows how Tamara's time passed on Saturday. Homework Housework 6 hours What fraction of Tamara's time was spent Reading 4 hours doing homework? 10 hours Sieeping

Elementary Geometry For College Students, 7e
7th Edition
ISBN:9781337614085
Author:Alexander, Daniel C.; Koeberlein, Geralyn M.
Publisher:Alexander, Daniel C.; Koeberlein, Geralyn M.
Chapter8: Areas Of Polygons And Circles
Section8.1: Area And Initial Postulates
Problem 3E: Consider the information in Exercise 2, but suppose you know that the area of the region defined by...

Related questions
Question
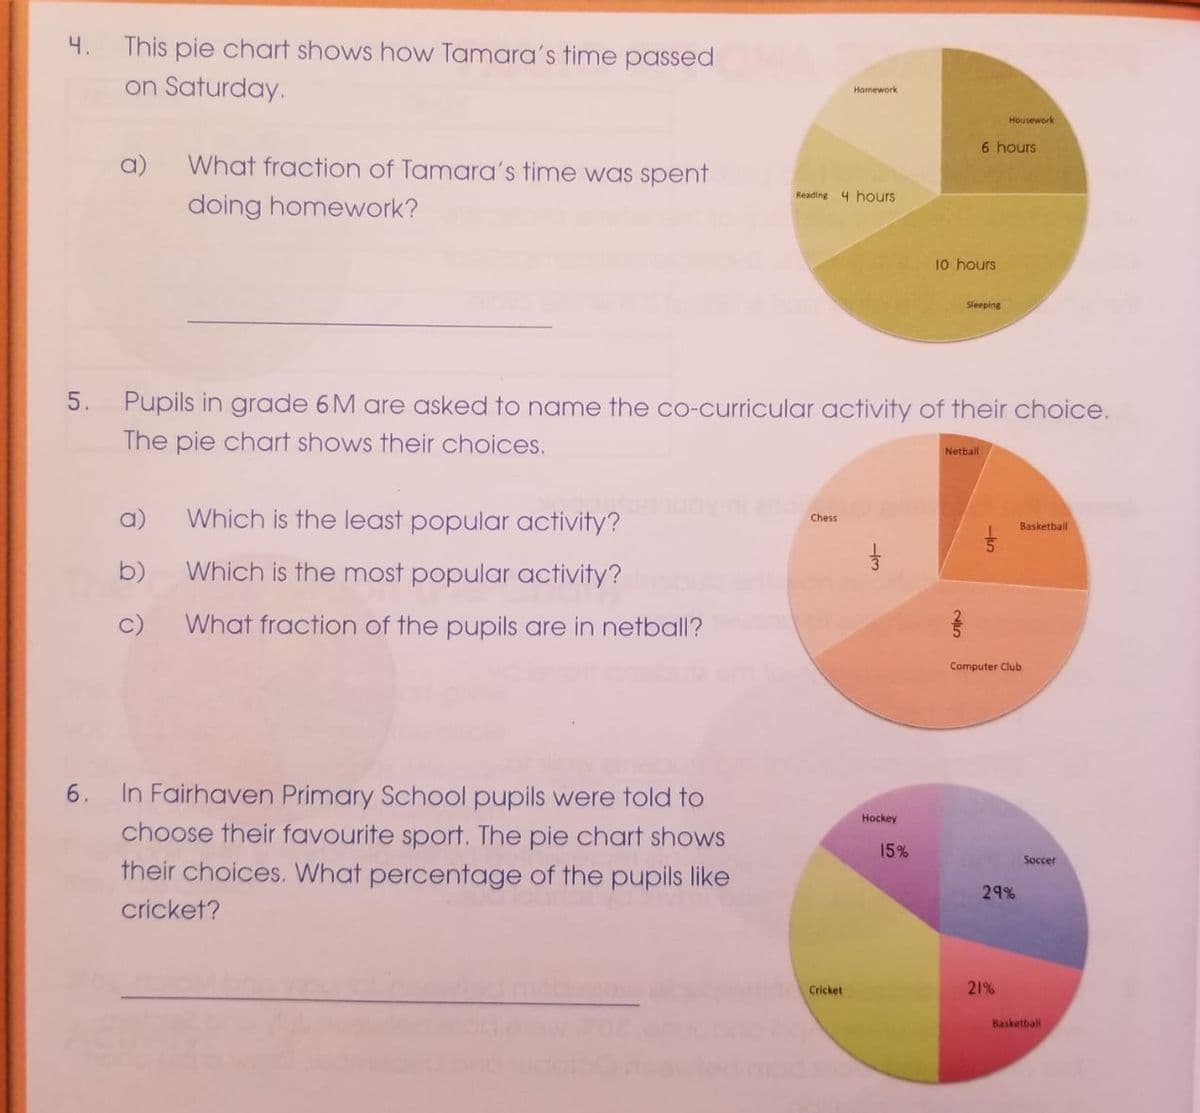
Transcribed Image Text:4.
This pie chart shows how Tamara's time passed
on Saturday.
Homework
Housework
6 hours
a)
What fraction of Tamara's time was spent
Reading 4 hours
doing homework?
10 hours
Sleeping
5. Pupils in grade 6M are asked to name the co-curricular activity of their choice.
The pie chart shows their choices.
Netball
a)
Which is the least popular activity?
Chess
Basketball
b)
Which is the most popular activity?
c)
What fraction of the pupils are in netball?
Computer Club
6.
In Fairhaven Primary School pupils were told to
Hockey
choose their favourite sport. The pie chart shows
15%
Soccer
their choices. What percentage of the pupils like
29%
cricket?
Cricket
21%
Basketbalil
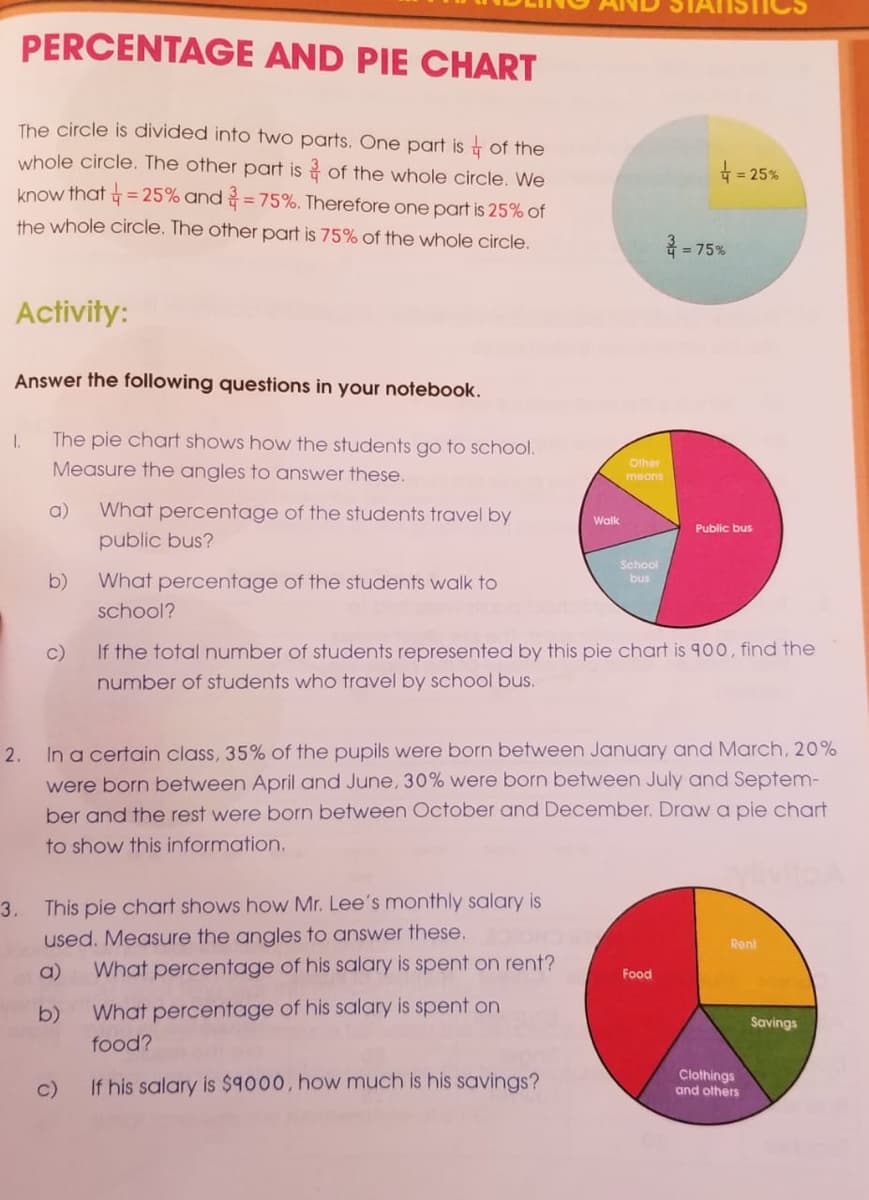
Transcribed Image Text:PERCENTAGE AND PIE CHART
The circle is divided into two parts. One part is of the
whole circle. The other part is of the whole circle. We
4 = 25%
know that = 25% and =75%. Therefore one part is 25% of
the whole circle. The other part is 75% of the whole circle.
= 75%
Activity:
Answer the following questions in your notebook.
1.
The pie chart shows how the students go to school.
Other
Measure the angles to answer these.
means
a)
What percentage of the students travel by
Walk
Public bus
public bus?
School
b)
What percentage of the students walk to
bus
school?
c)
If the total number of students represented by this pie chart is 900, find the
number of students who travel by school bus.
In a certain class, 35% of the pupils were born between January and March, 20%
were born between April and June, 30% were born between July and Septem-
ber and the rest were born between October and December. Draw a pie chart
2.
to show this information.
This pie chart shows how Mr. Lee's monthly salary is
used. Measure the angles to answer these.
What percentage of his salary is spent on rent?
3.
Rent
a)
Food
b)
What percentage of his salary is spent on
Savings
food?
c)
If his salary is $9000, how much is his savings?
Clothings
and olhers
Expert Solution
This question has been solved!
Explore an expertly crafted, step-by-step solution for a thorough understanding of key concepts.

Step by step
Solved in 2 steps with 3 images

Recommended textbooks for you
Elementary Geometry For College Students, 7e
Geometry
ISBN:
9781337614085
Author:
Alexander, Daniel C.; Koeberlein, Geralyn M.
Publisher:
Cengage,


Algebra and Trigonometry (MindTap Course List)
Algebra
ISBN:
9781305071742
Author:
James Stewart, Lothar Redlin, Saleem Watson
Publisher:
Cengage Learning
Elementary Geometry For College Students, 7e
Geometry
ISBN:
9781337614085
Author:
Alexander, Daniel C.; Koeberlein, Geralyn M.
Publisher:
Cengage,
Algebra and Trigonometry (MindTap Course List)
Algebra
ISBN:
9781305071742
Author:
James Stewart, Lothar Redlin, Saleem Watson
Publisher:
Cengage Learning

Holt Mcdougal Larson Pre-algebra: Student Edition…
Algebra
ISBN:
9780547587776
Author:
HOLT MCDOUGAL
Publisher:
HOLT MCDOUGAL

College Algebra (MindTap Course List)
Algebra
ISBN:
9781305652231
Author:
R. David Gustafson, Jeff Hughes
Publisher:
Cengage Learning

Mathematics For Machine Technology
Advanced Math
ISBN:
9781337798310
Author:
Peterson, John.
Publisher:
Cengage Learning,