4. To test the null hypothesis that two population means satisfy u1 = 42 by using matched pairs with two samples of size n, we require that n > 30 andn< N/20. Our test statistic TS is where d is the average difference of the matched pairs – with all subtractions done in the same order: first sample data minus second sample data! – and where sa is the sample standard deviation of the differences. The degrees of freedom is dof = n– 1. (a) For a two-tailed test, we may compute ta/2 = ±InvT(a/2, dof) and check that the test-statistic falls in a tail. Or we may instead compute P = 2 tcdf (|TS|, ∞, dof) and check that P< a. Suppose our null hypothesis is the population means agree (4 = 42), that our sample size is n = 100, and that we find d = -1.33 and sd = 2.72. i. If we use a two-tailed test, what is our alternative hypothesis: µi + µ2 ? µ1 < µ2 ? or ui > µ2 ? ii. What would we conclude if we rejected the null hypothesis with a two-tailed test? iii. Can we reject the null hypothesis at level of significance a = 0.05, using a two-tailed test?
4. To test the null hypothesis that two population means satisfy u1 = 42 by using matched pairs with two samples of size n, we require that n > 30 andn< N/20. Our test statistic TS is where d is the average difference of the matched pairs – with all subtractions done in the same order: first sample data minus second sample data! – and where sa is the sample standard deviation of the differences. The degrees of freedom is dof = n– 1. (a) For a two-tailed test, we may compute ta/2 = ±InvT(a/2, dof) and check that the test-statistic falls in a tail. Or we may instead compute P = 2 tcdf (|TS|, ∞, dof) and check that P< a. Suppose our null hypothesis is the population means agree (4 = 42), that our sample size is n = 100, and that we find d = -1.33 and sd = 2.72. i. If we use a two-tailed test, what is our alternative hypothesis: µi + µ2 ? µ1 < µ2 ? or ui > µ2 ? ii. What would we conclude if we rejected the null hypothesis with a two-tailed test? iii. Can we reject the null hypothesis at level of significance a = 0.05, using a two-tailed test?

MATLAB: An Introduction with Applications
6th Edition
ISBN:9781119256830
Author:Amos Gilat
Publisher:Amos Gilat
Chapter1: Starting With Matlab
Section: Chapter Questions
Problem 1P

Related questions
Question
Solve questions 1 through 4 please
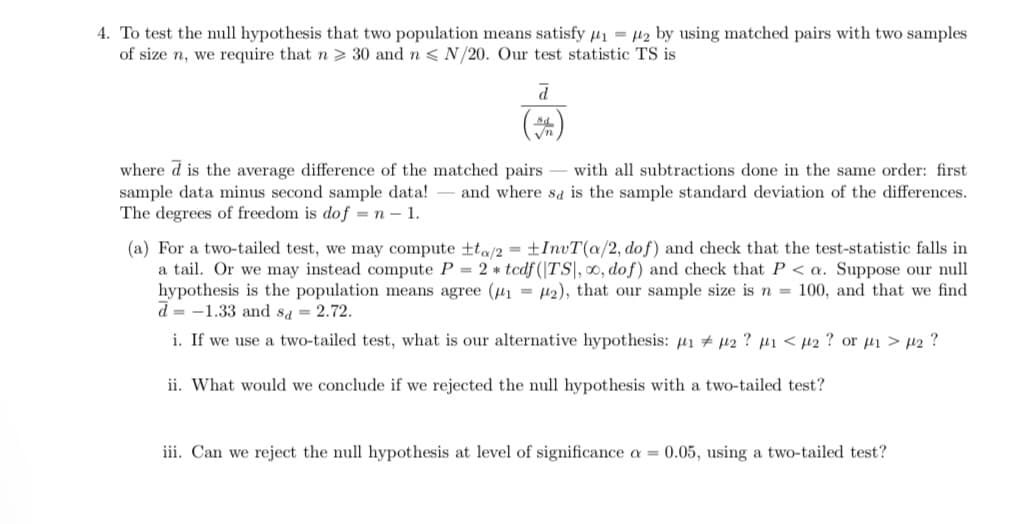
Transcribed Image Text:4. To test the null hypothesis that two population means satisfy µ1 = µ2 by using matched pairs with two samples
of size n, we require that n > 30 and n < N/20. Our test statistic TS is
(#)
where d is the average difference of the matched pairs - with all subtractions done in the same order: first
sample data minus second sample data!
The degrees of freedom is do f = n – 1.
and where sa is the sample standard deviation of the differences.
(a) For a two-tailed test, we may compute ±ta/2 = ±InvT(a/2, dof) and check that the test-statistic falls in
a tail. Or we may instead compute P = 2 * tcdf (|TS|, 0, dof) and check that P < a. Suppose our null
hypothesis is the population means agree (u1 = µ2), that our sample size is n = 100, and that we find
d = -1.33 and sa = 2.72.
i. If we use a two-tailed test, what is our alternative hypothesis: µi # µ2 ? µ1 < µ2 ? or µ1 > µ2 ?
ii. What would we conclude if we rejected the null hypothesis with a two-tailed test?
iii. Can we reject the null hypothesis
level of significance a = 0.05, using a two-tailed test?
Expert Solution
This question has been solved!
Explore an expertly crafted, step-by-step solution for a thorough understanding of key concepts.

Step by step
Solved in 4 steps

Knowledge Booster


Learn more about
Need a deep-dive on the concept behind this application? Look no further. Learn more about this topic, statistics and related others by exploring similar questions and additional content below.Recommended textbooks for you
MATLAB: An Introduction with Applications
Statistics
ISBN:
9781119256830
Author:
Amos Gilat
Publisher:
John Wiley & Sons Inc

Probability and Statistics for Engineering and th…
Statistics
ISBN:
9781305251809
Author:
Jay L. Devore
Publisher:
Cengage Learning

Statistics for The Behavioral Sciences (MindTap C…
Statistics
ISBN:
9781305504912
Author:
Frederick J Gravetter, Larry B. Wallnau
Publisher:
Cengage Learning
MATLAB: An Introduction with Applications
Statistics
ISBN:
9781119256830
Author:
Amos Gilat
Publisher:
John Wiley & Sons Inc
Probability and Statistics for Engineering and th…
Statistics
ISBN:
9781305251809
Author:
Jay L. Devore
Publisher:
Cengage Learning
Statistics for The Behavioral Sciences (MindTap C…
Statistics
ISBN:
9781305504912
Author:
Frederick J Gravetter, Larry B. Wallnau
Publisher:
Cengage Learning

Elementary Statistics: Picturing the World (7th E…
Statistics
ISBN:
9780134683416
Author:
Ron Larson, Betsy Farber
Publisher:
PEARSON

The Basic Practice of Statistics
Statistics
ISBN:
9781319042578
Author:
David S. Moore, William I. Notz, Michael A. Fligner
Publisher:
W. H. Freeman

Introduction to the Practice of Statistics
Statistics
ISBN:
9781319013387
Author:
David S. Moore, George P. McCabe, Bruce A. Craig
Publisher:
W. H. Freeman