4. Various measures of cost Douglas Fur is a small manufacturer of fake-fur boots in San Diego. The following table shows the company's total cost of production at various production quantities. Fill in the remaining cells of the following table. Quantity Total Cost Marginal Cost Fixed Cost Variable Cost Average Variable Cost Average Total Cost (Pairs) (Dollars) (Dollars) (Dollars) (Dollars) (Dollars per pair) (Dollars per pair) 120 1 200 240 3 285 4 340 425 6 540 On the following graph, plot Douglas Fur's average total cost (ATC) curve using the green points (triangle symbol). Next, plot its average variable cost (AVC) curve using the purple points (diamond symbol). Finally, plot its marginal cost (MC) curve using the orange points (square symbol). (Hint: For ATC and AVC, plot the points on the integer; for example, the ATC of producing one pair of boots is $200, so you should start your ATC curve by placing a green point at (1, 200). For MC, plot the points between the integers: For example, the MC of increasing production from zero to one pair of boots is $80, so you should start your MC curve by placing an orange square at (0.5, 80).) Note: Plot your points in the order in which you would like them connected. Line segments will connect the points automatically. AAAAAA
4. Various measures of cost Douglas Fur is a small manufacturer of fake-fur boots in San Diego. The following table shows the company's total cost of production at various production quantities. Fill in the remaining cells of the following table. Quantity Total Cost Marginal Cost Fixed Cost Variable Cost Average Variable Cost Average Total Cost (Pairs) (Dollars) (Dollars) (Dollars) (Dollars) (Dollars per pair) (Dollars per pair) 120 1 200 240 3 285 4 340 425 6 540 On the following graph, plot Douglas Fur's average total cost (ATC) curve using the green points (triangle symbol). Next, plot its average variable cost (AVC) curve using the purple points (diamond symbol). Finally, plot its marginal cost (MC) curve using the orange points (square symbol). (Hint: For ATC and AVC, plot the points on the integer; for example, the ATC of producing one pair of boots is $200, so you should start your ATC curve by placing a green point at (1, 200). For MC, plot the points between the integers: For example, the MC of increasing production from zero to one pair of boots is $80, so you should start your MC curve by placing an orange square at (0.5, 80).) Note: Plot your points in the order in which you would like them connected. Line segments will connect the points automatically. AAAAAA

Essentials of Economics (MindTap Course List)
8th Edition
ISBN:9781337091992
Author:N. Gregory Mankiw
Publisher:N. Gregory Mankiw
Chapter12: The Cost Of Production
Section: Chapter Questions
Problem 3PA

Related questions
Question
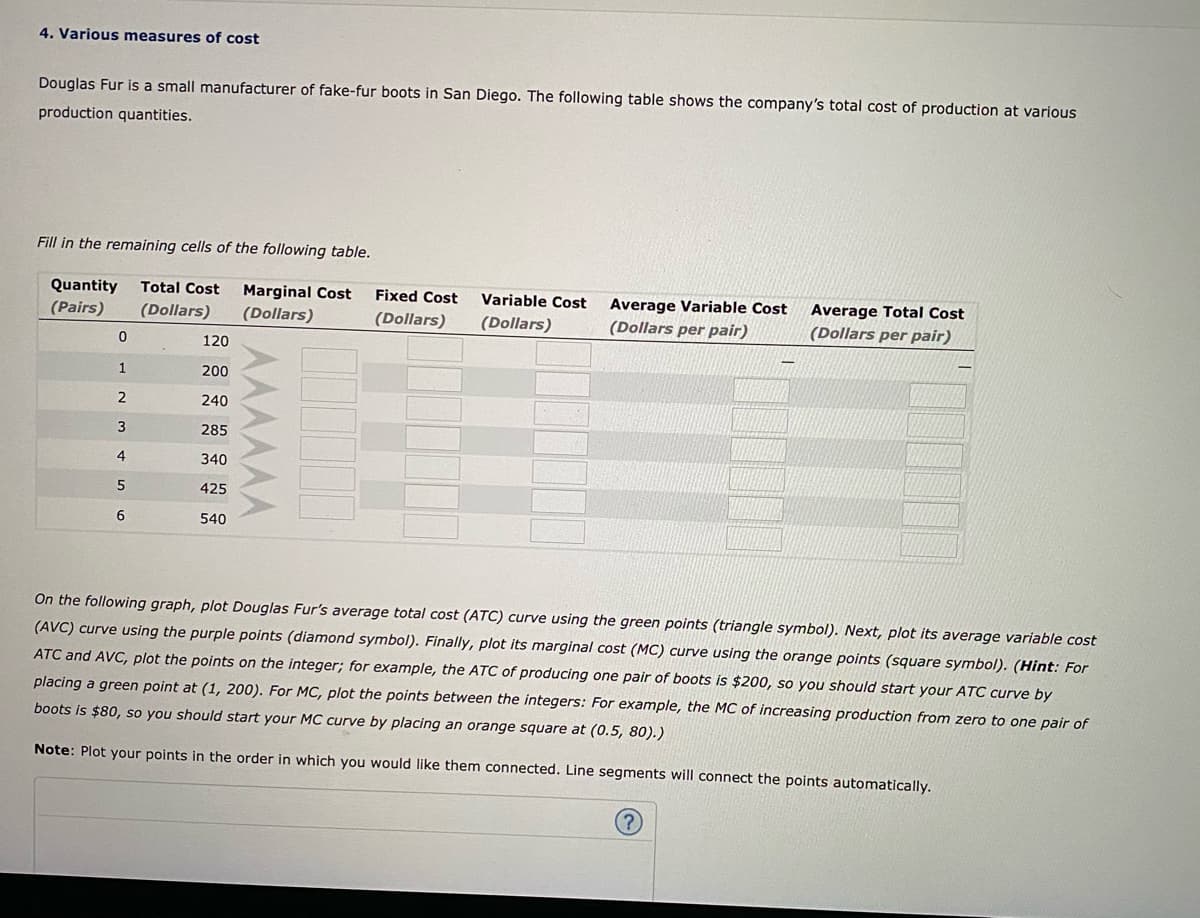
Transcribed Image Text:4. Variouss measures of cost
Douglas Fur is a small manufacturer of fake-fur boots in San Diego. The following table shows the company's total cost of production at various
production quantities.
Fill in the remaining cells of the following table.
Quantity
Total Cost
Marginal Cost
(Dollars)
Fixed Cost
Variable Cost
Average Variable Cost
Average Total Cost
(Pairs)
(Dollars)
(Dollars)
(Dollars)
(Dollars per pair)
(Dollars per pair)
120
1
200
2
240
3
285
4
340
425
6
540
On the following graph, plot Douglas Fur's average total cost (ATC) curve using the green points (triangle symbol). Next, plot its average variable cost
(AVC) curve using the purple points (diamond symbol). Finally, plot its marginal cost (MC) curve using the orange points (square symbol). (Hint: For
ATC and AVC, plot the points on the integer; for example, the ATC of producing one pair of boots is $200, so you should start your ATC curve by
placing a green point at (1, 200). For MC, plot the points between the integers: For example, the MC of increasing production from zero to one pair of
boots is $80, so you should start your MC curve by placing an orange square at (0.5, 80).)
Note: Plot your points in the order in which you would like them connected. Line segments will connect the points automatically.
AMAAAA
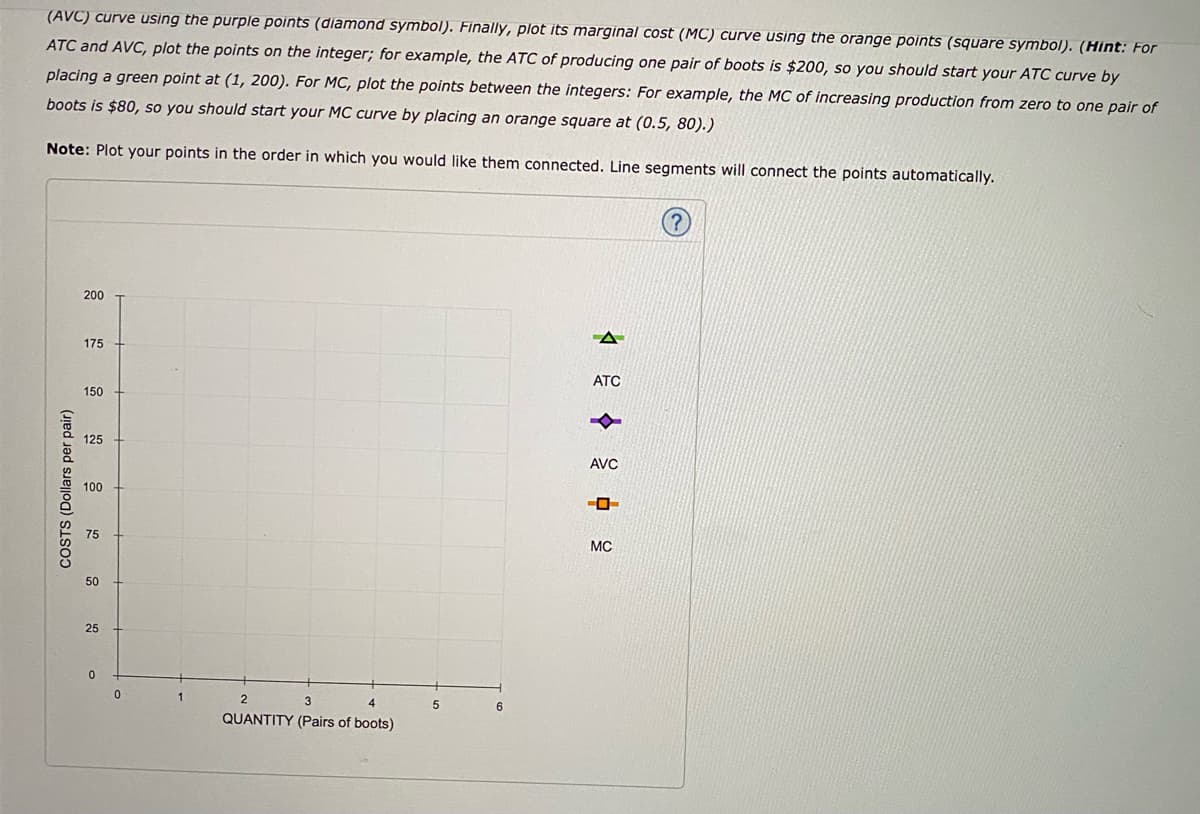
Transcribed Image Text:(AVC) curve using the purple points (diamond symbol). Finally, plot its marginal cost (MC) curve using the orange points (square symbol). (Hint: For
ATC and AVC, plot the points on the integer; for example, the ATC of producing one pair of boots is $200, so you should start your ATC curve by
placing a green point at (1, 200). For MC, plot the points between the integers: For example, the MC of increasing production from zero to one pair of
boots is $80, so you should start your MC curve by placing an orange square at (0.5, 80).)
Note: Plot your points in the order in which you would like them connected. Line segments will connect the points automatically.
200
175
АТС
150
125
AVC
MC
50
25
1.
3
5
6
QUANTITY (Pairs of boots)
COSTS (Dollars per pair)
Expert Solution
This question has been solved!
Explore an expertly crafted, step-by-step solution for a thorough understanding of key concepts.

This is a popular solution!

Trending now
This is a popular solution!

Step by step
Solved in 2 steps with 2 images

Knowledge Booster


Learn more about
Need a deep-dive on the concept behind this application? Look no further. Learn more about this topic, economics and related others by exploring similar questions and additional content below.Recommended textbooks for you
Essentials of Economics (MindTap Course List)
Economics
ISBN:
9781337091992
Author:
N. Gregory Mankiw
Publisher:
Cengage Learning

Principles of Economics, 7th Edition (MindTap Cou…
Economics
ISBN:
9781285165875
Author:
N. Gregory Mankiw
Publisher:
Cengage Learning

Principles of Economics (MindTap Course List)
Economics
ISBN:
9781305585126
Author:
N. Gregory Mankiw
Publisher:
Cengage Learning
Essentials of Economics (MindTap Course List)
Economics
ISBN:
9781337091992
Author:
N. Gregory Mankiw
Publisher:
Cengage Learning
Principles of Economics, 7th Edition (MindTap Cou…
Economics
ISBN:
9781285165875
Author:
N. Gregory Mankiw
Publisher:
Cengage Learning
Principles of Economics (MindTap Course List)
Economics
ISBN:
9781305585126
Author:
N. Gregory Mankiw
Publisher:
Cengage Learning


Principles of Economics 2e
Economics
ISBN:
9781947172364
Author:
Steven A. Greenlaw; David Shapiro
Publisher:
OpenStax
