4. What is the mode of the data set? 5. Calculate the mean and median INCLUDING the outlier: median = 6. Calculate the mean and median EXCLUDING the outlier: median = 7. Which measure (mean or median) do you think is the best in terms of the average rushing yards of a Charger? Explain.
4. What is the mode of the data set? 5. Calculate the mean and median INCLUDING the outlier: median = 6. Calculate the mean and median EXCLUDING the outlier: median = 7. Which measure (mean or median) do you think is the best in terms of the average rushing yards of a Charger? Explain.

MATLAB: An Introduction with Applications
6th Edition
ISBN:9781119256830
Author:Amos Gilat
Publisher:Amos Gilat
Chapter1: Starting With Matlab
Section: Chapter Questions
Problem 1P

Related questions
Question
100%
What is the answer of this questions?
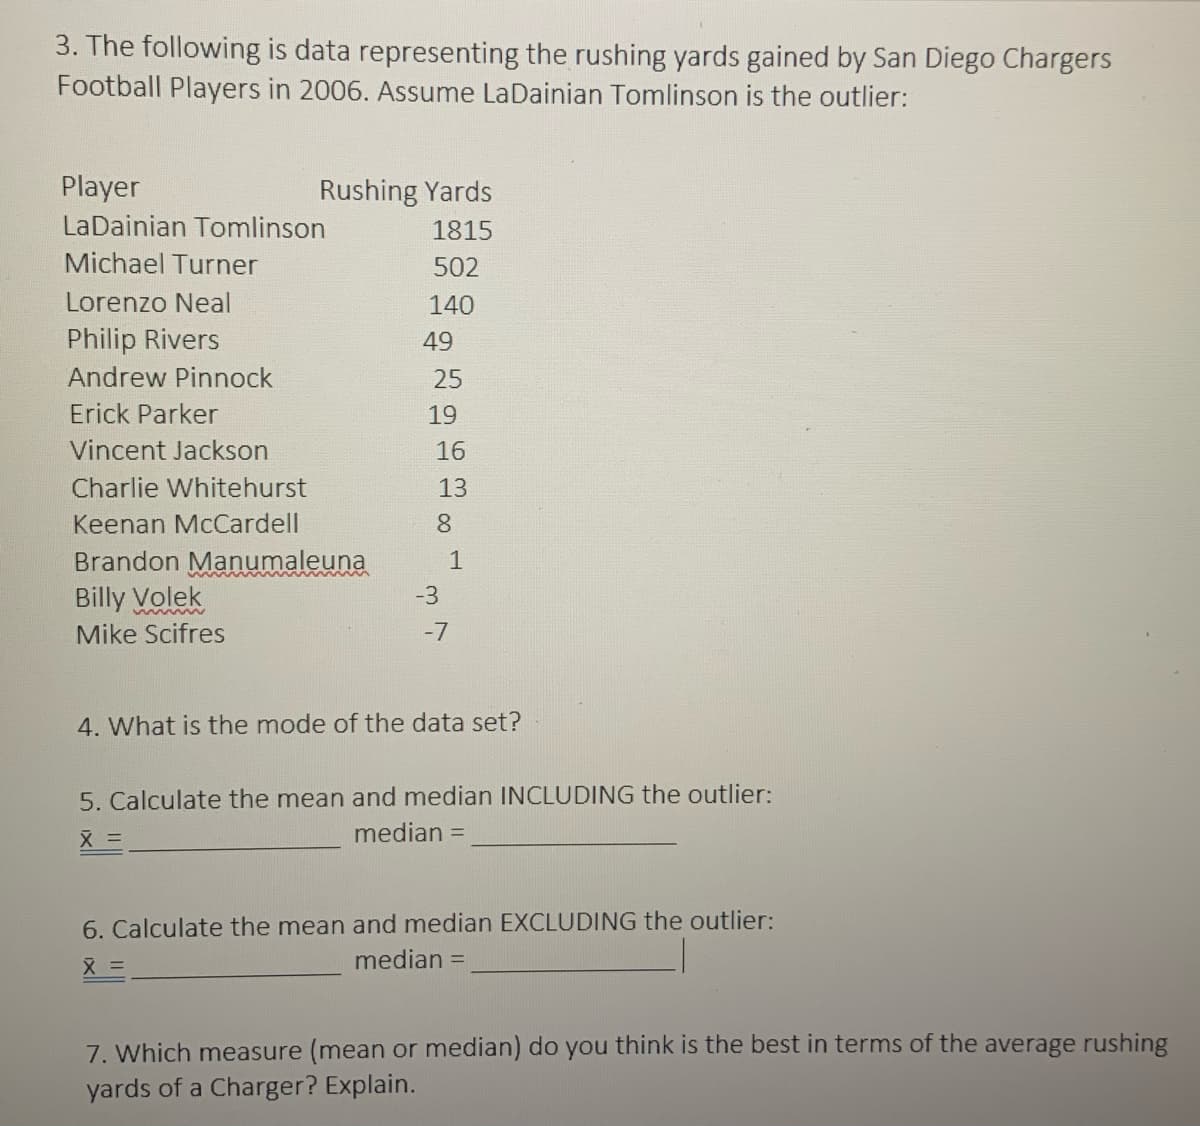
Transcribed Image Text:3. The following is data representing the rushing yards gained by San Diego Chargers
Football Players in 2006. Assume LaDainian Tomlinson is the outlier:
Player
Rushing Yards
LaDainian Tomlinson
1815
Michael Turner
502
Lorenzo Neal
140
Philip Rivers
49
Andrew Pinnock
25
Erick Parker
19
Vincent Jackson
16
Charlie Whitehurst
13
Keenan McCardell
8.
Brandon Manumaleuna
Billy Volek
-3
Mike Scifres
-7
4. What is the mode of the data set?
5. Calculate the mean and median INCLUDING the outlier:
median =
6. Calculate the mean and median EXCLUDING the outlier:
median =
7. Which measure (mean or median) do you think is the best in terms of the average rushing
yards of a Charger? Explain.
Expert Solution
This question has been solved!
Explore an expertly crafted, step-by-step solution for a thorough understanding of key concepts.

This is a popular solution!

Trending now
This is a popular solution!

Step by step
Solved in 3 steps with 3 images

Recommended textbooks for you
MATLAB: An Introduction with Applications
Statistics
ISBN:
9781119256830
Author:
Amos Gilat
Publisher:
John Wiley & Sons Inc

Probability and Statistics for Engineering and th…
Statistics
ISBN:
9781305251809
Author:
Jay L. Devore
Publisher:
Cengage Learning

Statistics for The Behavioral Sciences (MindTap C…
Statistics
ISBN:
9781305504912
Author:
Frederick J Gravetter, Larry B. Wallnau
Publisher:
Cengage Learning
MATLAB: An Introduction with Applications
Statistics
ISBN:
9781119256830
Author:
Amos Gilat
Publisher:
John Wiley & Sons Inc
Probability and Statistics for Engineering and th…
Statistics
ISBN:
9781305251809
Author:
Jay L. Devore
Publisher:
Cengage Learning
Statistics for The Behavioral Sciences (MindTap C…
Statistics
ISBN:
9781305504912
Author:
Frederick J Gravetter, Larry B. Wallnau
Publisher:
Cengage Learning

Elementary Statistics: Picturing the World (7th E…
Statistics
ISBN:
9780134683416
Author:
Ron Larson, Betsy Farber
Publisher:
PEARSON

The Basic Practice of Statistics
Statistics
ISBN:
9781319042578
Author:
David S. Moore, William I. Notz, Michael A. Fligner
Publisher:
W. H. Freeman

Introduction to the Practice of Statistics
Statistics
ISBN:
9781319013387
Author:
David S. Moore, George P. McCabe, Bruce A. Craig
Publisher:
W. H. Freeman