4. What proportion, percent, and number of people of the people had well-being scores less than 120 points? 5. What proportion, percent, and number of people had well-being scores between 90 and 110 points? 6. What proportion, percent, and number of people had well-being scores between 112 and 126 points?
4. What proportion, percent, and number of people of the people had well-being scores less than 120 points? 5. What proportion, percent, and number of people had well-being scores between 90 and 110 points? 6. What proportion, percent, and number of people had well-being scores between 112 and 126 points?

MATLAB: An Introduction with Applications
6th Edition
ISBN:9781119256830
Author:Amos Gilat
Publisher:Amos Gilat
Chapter1: Starting With Matlab
Section: Chapter Questions
Problem 1P

Related questions

Question
subparts 4-6
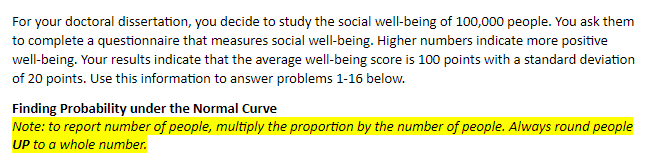
Transcribed Image Text:For your doctoral dissertation, you decide to study the social well-being of 100,000 people. You ask them
to complete a questionnaire that measures social well-being. Higher numbers indicate more positive
well-being. Your results indicate that the average well-being score is 100 points with a standard deviation
of 20 points. Use this information to answer problems 1-16 below.
Finding Probability under the Normal Curve
Note: to report number of people, multiply the proportion by the number of people. Always round people
UP to a whole number.
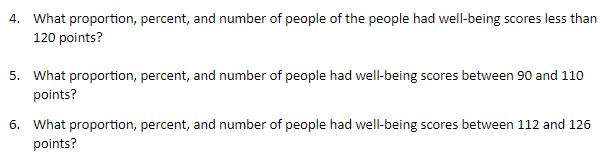
Transcribed Image Text:4. What proportion, percent, and number of people of the people had well-being scores less than
120 points?
5. What proportion, percent, and number of people had well-being scores between 90 and 110
points?
6. What proportion, percent, and number of people had well-being scores between 112 and 126
points?
Expert Solution
This question has been solved!
Explore an expertly crafted, step-by-step solution for a thorough understanding of key concepts.

This is a popular solution!

Trending now
This is a popular solution!

Step by step
Solved in 2 steps

Knowledge Booster


Learn more about
Need a deep-dive on the concept behind this application? Look no further. Learn more about this topic, statistics and related others by exploring similar questions and additional content below.Recommended textbooks for you
MATLAB: An Introduction with Applications
Statistics
ISBN:
9781119256830
Author:
Amos Gilat
Publisher:
John Wiley & Sons Inc

Probability and Statistics for Engineering and th…
Statistics
ISBN:
9781305251809
Author:
Jay L. Devore
Publisher:
Cengage Learning

Statistics for The Behavioral Sciences (MindTap C…
Statistics
ISBN:
9781305504912
Author:
Frederick J Gravetter, Larry B. Wallnau
Publisher:
Cengage Learning
MATLAB: An Introduction with Applications
Statistics
ISBN:
9781119256830
Author:
Amos Gilat
Publisher:
John Wiley & Sons Inc
Probability and Statistics for Engineering and th…
Statistics
ISBN:
9781305251809
Author:
Jay L. Devore
Publisher:
Cengage Learning
Statistics for The Behavioral Sciences (MindTap C…
Statistics
ISBN:
9781305504912
Author:
Frederick J Gravetter, Larry B. Wallnau
Publisher:
Cengage Learning

Elementary Statistics: Picturing the World (7th E…
Statistics
ISBN:
9780134683416
Author:
Ron Larson, Betsy Farber
Publisher:
PEARSON

The Basic Practice of Statistics
Statistics
ISBN:
9781319042578
Author:
David S. Moore, William I. Notz, Michael A. Fligner
Publisher:
W. H. Freeman

Introduction to the Practice of Statistics
Statistics
ISBN:
9781319013387
Author:
David S. Moore, George P. McCabe, Bruce A. Craig
Publisher:
W. H. Freeman