400 350 383 300 250 -2718 200 150 173.7 100 50 Annual rainfalls for Metropolis are given in the following table ("Annual maximums of," 2013). The box plot above provides one visual depiction of the data distribution. Use it or construct a frequency table and/or frequency histogram (use 8 classes) to analyze the distribution of this data. Then, select which of the following statements about distribution of this data is most correct: Table: Annual Rainfall in Metropolis 146.8 383 90.9 178.1 267.5 95.5 156.5 180 90.9 139.7 200.2 171.7 187.2 184.9 70.1 58 84.1 55.6 133.1 271.8 135.9 71.9 99.4 110.6 47.5 97.8 122.7 58.4 154.4 173.7 118.8 88 84.6 171.5 254.3 185.9 137.2 138.9 96.2 85 45.2 Question 5 options: 74.7 264.9 113.8 133.4 68.1 156.4 A) Data appears NOT to be distributed normally (unimodal but mean appears to be less than median); one outlier exists (383); skew to left is discernable and supports relationship of mean to median B) Data appears to be distributed normally (unimodal with mean and median roughly equivalent); one outlier exists (383); no discernable skew C) Data appears NOT to be distributed normally (unimodal but mean appears to be greater than median); one outlier exists (383); skew to right is discernable and supports relationship of mean to median Annual Rainfall, Inches
400 350 383 300 250 -2718 200 150 173.7 100 50 Annual rainfalls for Metropolis are given in the following table ("Annual maximums of," 2013). The box plot above provides one visual depiction of the data distribution. Use it or construct a frequency table and/or frequency histogram (use 8 classes) to analyze the distribution of this data. Then, select which of the following statements about distribution of this data is most correct: Table: Annual Rainfall in Metropolis 146.8 383 90.9 178.1 267.5 95.5 156.5 180 90.9 139.7 200.2 171.7 187.2 184.9 70.1 58 84.1 55.6 133.1 271.8 135.9 71.9 99.4 110.6 47.5 97.8 122.7 58.4 154.4 173.7 118.8 88 84.6 171.5 254.3 185.9 137.2 138.9 96.2 85 45.2 Question 5 options: 74.7 264.9 113.8 133.4 68.1 156.4 A) Data appears NOT to be distributed normally (unimodal but mean appears to be less than median); one outlier exists (383); skew to left is discernable and supports relationship of mean to median B) Data appears to be distributed normally (unimodal with mean and median roughly equivalent); one outlier exists (383); no discernable skew C) Data appears NOT to be distributed normally (unimodal but mean appears to be greater than median); one outlier exists (383); skew to right is discernable and supports relationship of mean to median Annual Rainfall, Inches

Big Ideas Math A Bridge To Success Algebra 1: Student Edition 2015
1st Edition
ISBN:9781680331141
Author:HOUGHTON MIFFLIN HARCOURT
Publisher:HOUGHTON MIFFLIN HARCOURT
Chapter11: Data Analysis And Displays
Section: Chapter Questions
Problem 10CT

Related questions
Question
Transcribed Image Text:400
350
0383
300
250
-271.8
200
150
173.7
X1369106383
100
133.1
85
50
-45.2
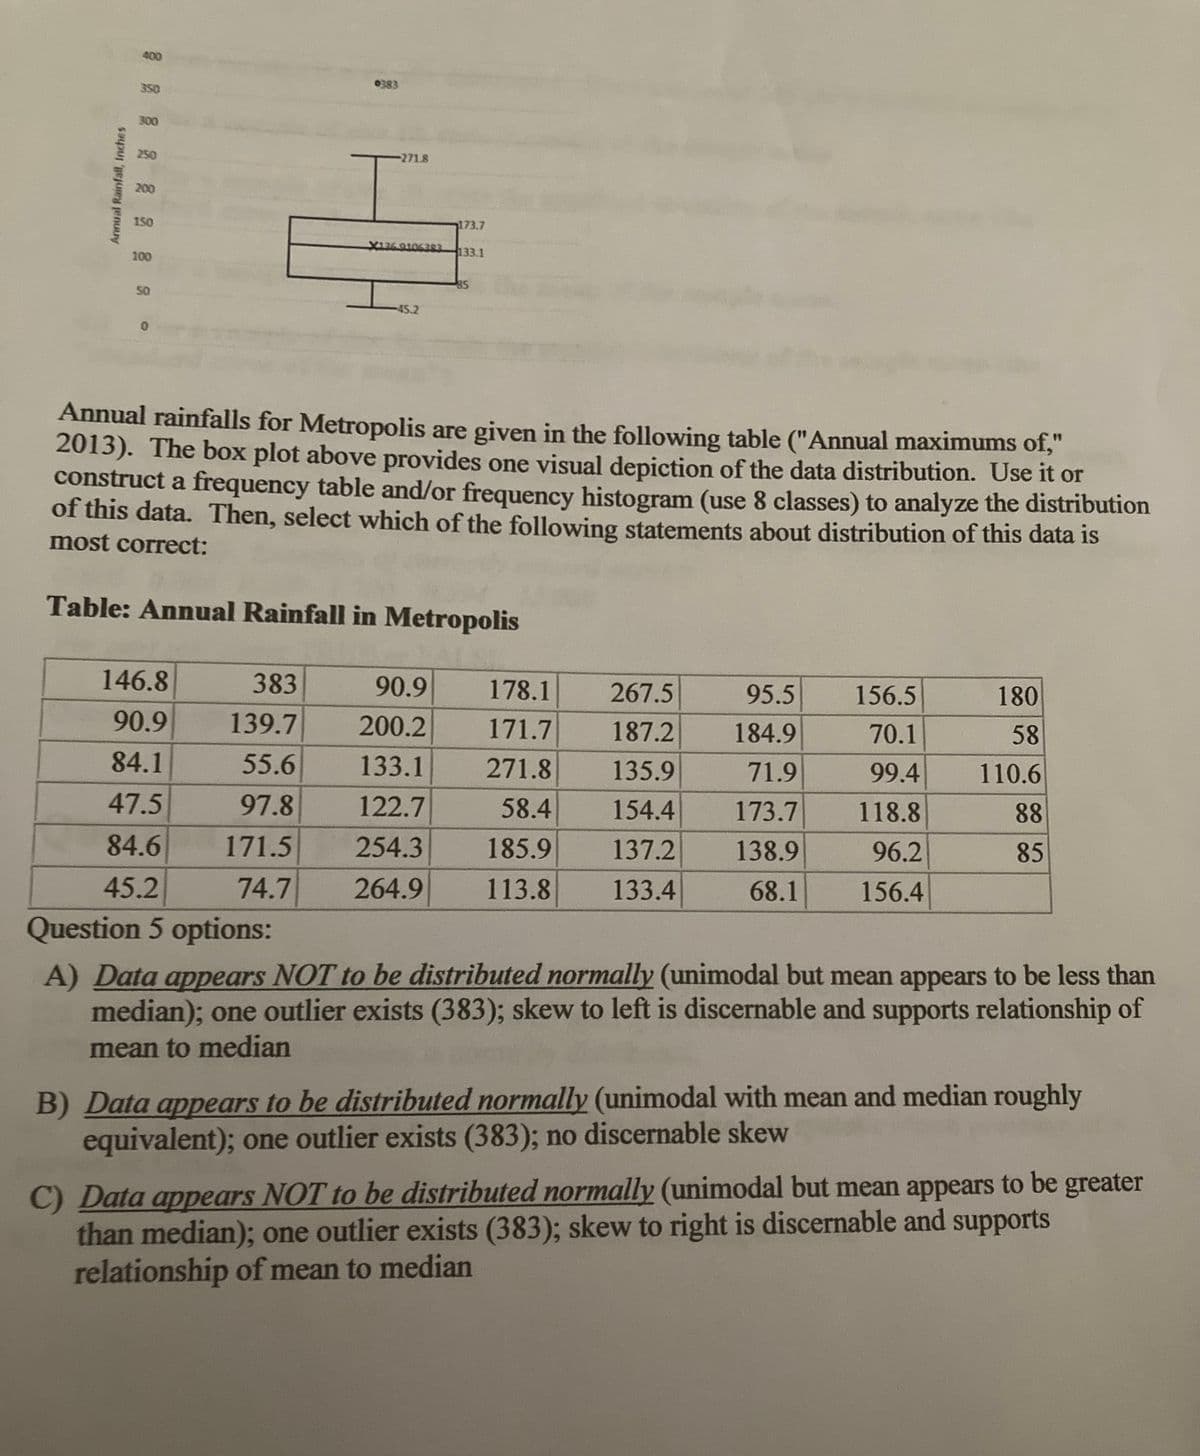
Annual rainfalls for Metropolis are given in the following table ("Annual maximums of,"
2013). The box plot above provides one visual depiction of the data distribution. Use it or
construct a frequency table and/or frequency histogram (use 8 classes) to analyze the distribution
of this data. Then, select which of the following statements about distribution of this data is
most correct:
Table: Annual Rainfall in Metropolis
146.8
383
90.9
178.1
267.5
95.5
156.5
180
90.9
139.7
200.2
171.7
187.2
184.9
70.1
58
84.1
55.6
133.1
271.8
135.9
71.9
99.4
110.6
47.5
97.8
122.7
58.4
154.4
173.7
118.8
88
84.6
171.5
254.3
185.9
137.2
138.9
96.2
85
45.2
74.7
264.9
113.8
133.4
68.1
156.4
Question 5 options:
A) Data appears NOT to be distributed normally (unimodal but mean appears to be less than
median); one outlier exists (383); skew to left is discernable and supports relationship of
mean to median
B) Data appears to be distributed normally (unimodal with mean and median roughly
equivalent); one outlier exists (383); no discernable skew
C) Data appears NOT to be distributed normally (unimodal but mean appears to be greater
than median); one outlier exists (383); skew to right is discernable and supports
relationship of mean to median
Annual Rainfall, Inches
Expert Solution
This question has been solved!
Explore an expertly crafted, step-by-step solution for a thorough understanding of key concepts.

This is a popular solution!

Trending now
This is a popular solution!

Step by step
Solved in 2 steps

Knowledge Booster


Learn more about
Need a deep-dive on the concept behind this application? Look no further. Learn more about this topic, statistics and related others by exploring similar questions and additional content below.Recommended textbooks for you
Big Ideas Math A Bridge To Success Algebra 1: Stu…
Algebra
ISBN:
9781680331141
Author:
HOUGHTON MIFFLIN HARCOURT
Publisher:
Houghton Mifflin Harcourt


Glencoe Algebra 1, Student Edition, 9780079039897…
Algebra
ISBN:
9780079039897
Author:
Carter
Publisher:
McGraw Hill
Big Ideas Math A Bridge To Success Algebra 1: Stu…
Algebra
ISBN:
9781680331141
Author:
HOUGHTON MIFFLIN HARCOURT
Publisher:
Houghton Mifflin Harcourt
Glencoe Algebra 1, Student Edition, 9780079039897…
Algebra
ISBN:
9780079039897
Author:
Carter
Publisher:
McGraw Hill