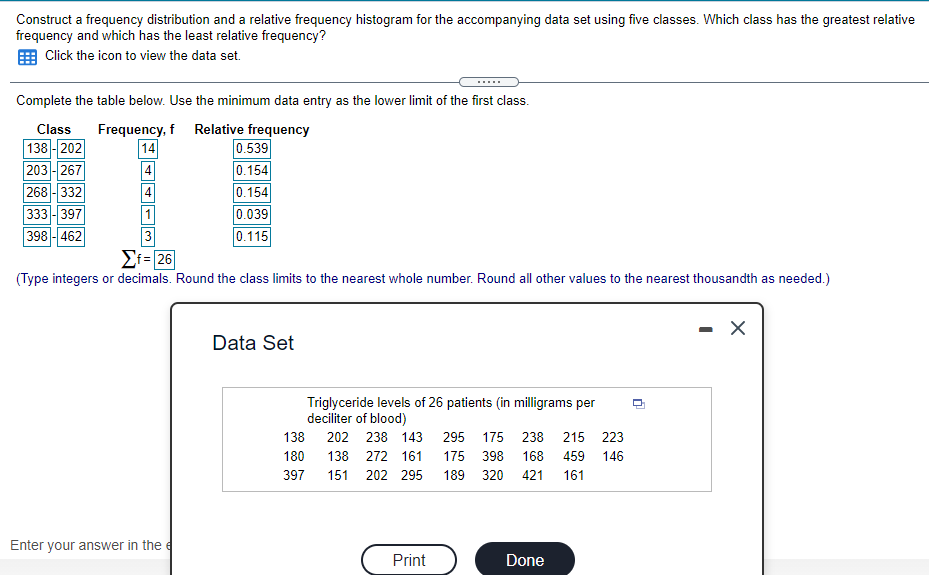
Construct a frequency distribution and a relative frequency histogram for the accompanying data set using five classes. Which class has the greatest relative frequency and which has the least relative frequency? Click the icon to view the data set. ..... Complete the table below. Use the minimum data entry as the lower limit of the first class. Class 138 -202 203 -267 268 -332 Frequency, f Relative frequency 0.539 0.154 14 4 4 0.154 333 -397 0.039 0.115 1 398- 462 3 Ei= 26 (Type integers or decimals. Round the class limits to the nearest whole number. Round all other values to the nearest thousandth as needed.) Data Set Triglyceride levels of 26 patients (in milligrams per deciliter of blood) 138 202 238 143 295 175 238 215 223 180 138 272 161 175 398 168 459 146 397 151 202 295 189 320 421 161 Enter vour answer in the
Construct a frequency distribution and a relative frequency histogram for the accompanying data set using five classes. Which class has the greatest relative frequency and which has the least relative frequency? Click the icon to view the data set. ..... Complete the table below. Use the minimum data entry as the lower limit of the first class. Class 138 -202 203 -267 268 -332 Frequency, f Relative frequency 0.539 0.154 14 4 4 0.154 333 -397 0.039 0.115 1 398- 462 3 Ei= 26 (Type integers or decimals. Round the class limits to the nearest whole number. Round all other values to the nearest thousandth as needed.) Data Set Triglyceride levels of 26 patients (in milligrams per deciliter of blood) 138 202 238 143 295 175 238 215 223 180 138 272 161 175 398 168 459 146 397 151 202 295 189 320 421 161 Enter vour answer in the

Glencoe Algebra 1, Student Edition, 9780079039897, 0079039898, 2018
18th Edition
ISBN:9780079039897
Author:Carter
Publisher:Carter
Chapter10: Statistics
Section10.5: Comparing Sets Of Data
Problem 14PPS

Related questions
Question
Transcribed Image Text:Construct a frequency distribution and a relative frequency histogram for the accompanying data set using five classes. Which class has the greatest relative
frequency and which has the least relative frequency?
Click the icon to view the data set.
.....
Complete the table below. Use the minimum data entry as the lower limit of the first class.
Class
138 -202
203 -267
268 -332
Frequency, f Relative frequency
0.539
0.154
0.154
14
4
333 -397
1
3
Ei= 26
0.039
398 - 462
0.115
(Type integers or decimals. Round the class limits to the nearest whole number. Round all other values to the nearest thousandth as needed.)
Data Set
Triglyceride levels of 26 patients (in milligrams per
deciliter of blood)
138
202 238 143 295
175 238 215 223
180
138 272 161
175 398 168
459 146
397
151
202 295
189 320
421
161
Enter your answer in the e
Print
Done
Expert Solution
This question has been solved!
Explore an expertly crafted, step-by-step solution for a thorough understanding of key concepts.

This is a popular solution!

Trending now
This is a popular solution!

Step by step
Solved in 2 steps

Knowledge Booster


Learn more about
Need a deep-dive on the concept behind this application? Look no further. Learn more about this topic, statistics and related others by exploring similar questions and additional content below.Recommended textbooks for you
Glencoe Algebra 1, Student Edition, 9780079039897…
Algebra
ISBN:
9780079039897
Author:
Carter
Publisher:
McGraw Hill
Glencoe Algebra 1, Student Edition, 9780079039897…
Algebra
ISBN:
9780079039897
Author:
Carter
Publisher:
McGraw Hill