Question1 From the following classified data, find the mean. Sketch the relative frequency polygon and the cumulative frequency curves? Class limits 50-69 70-89 90-109 110-129 130-149 Frequency 4 9. Solution:
Question1 From the following classified data, find the mean. Sketch the relative frequency polygon and the cumulative frequency curves? Class limits 50-69 70-89 90-109 110-129 130-149 Frequency 4 9. Solution:

Glencoe Algebra 1, Student Edition, 9780079039897, 0079039898, 2018
18th Edition
ISBN:9780079039897
Author:Carter
Publisher:Carter
Chapter10: Statistics
Section10.6: Summarizing Categorical Data
Problem 4BGP

Related questions
Question
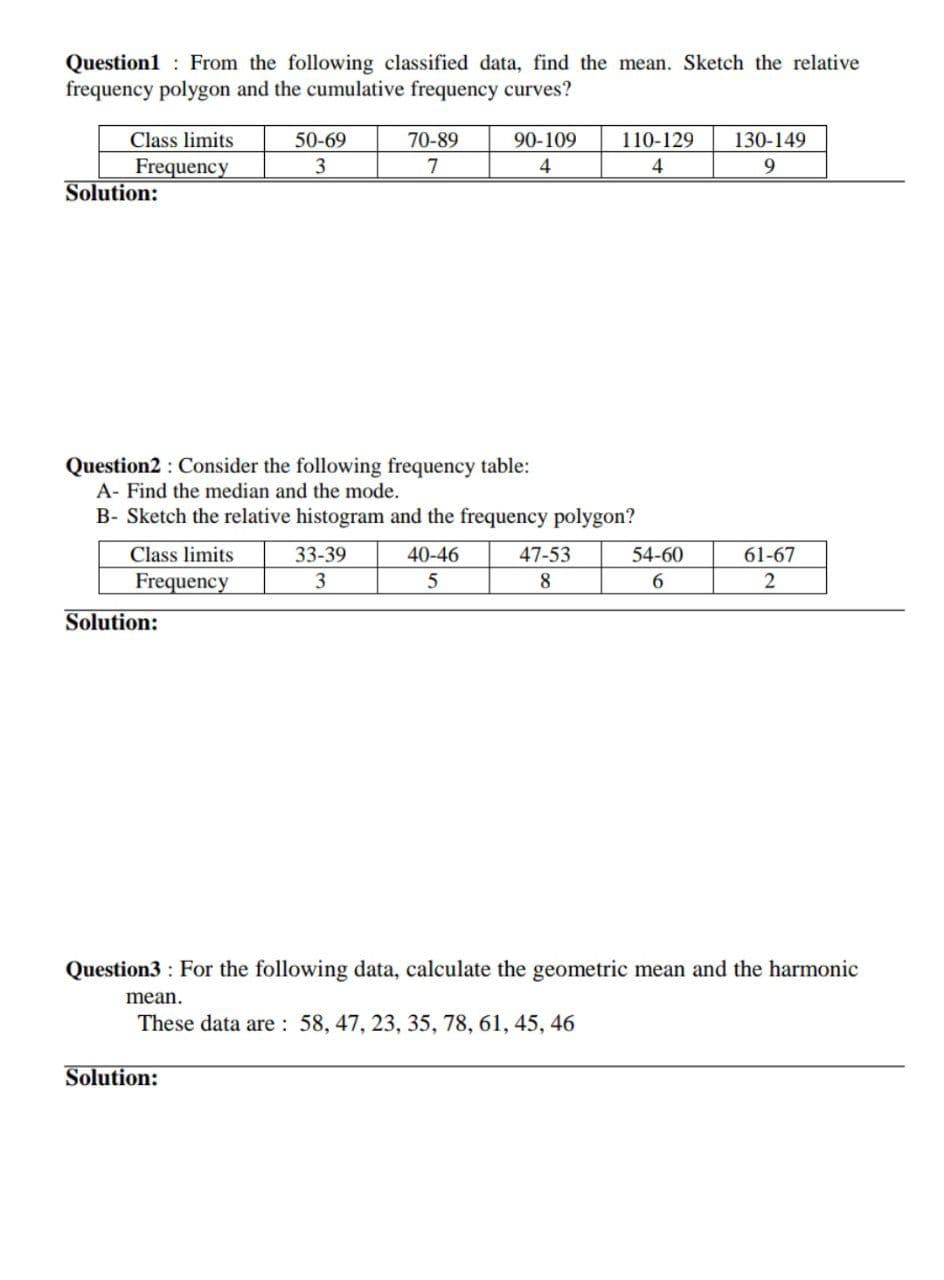
Transcribed Image Text:Question1 From the following classified data, find the mean. Sketch the relative
frequency polygon and the cumulative frequency curves?
Class limits
50-69
70-89
90-109
110-129
130-149
Frequency
3
7
9
Solution:
Question2 : Consider the following frequency table:
A- Find the median and the mode.
B- Sketch the relative histogram and the frequency polygon?
Class limits
33-39
40-46
47-53
54-60
61-67
Frequency
3
8
Solution:
Question3 : For the following data, calculate the geometric mean and the harmonic
mean.
These data are : 58, 47, 23, 35, 78, 61, 45, 46
Solution:
Expert Solution
This question has been solved!
Explore an expertly crafted, step-by-step solution for a thorough understanding of key concepts.

Step by step
Solved in 4 steps with 2 images

Recommended textbooks for you
Glencoe Algebra 1, Student Edition, 9780079039897…
Algebra
ISBN:
9780079039897
Author:
Carter
Publisher:
McGraw Hill
Glencoe Algebra 1, Student Edition, 9780079039897…
Algebra
ISBN:
9780079039897
Author:
Carter
Publisher:
McGraw Hill