0.40- 0.35- 0.30- 0.25- 0.20 0.15- 0.10- 0.05- 0- 500 1,000 1,500 2,000 2,500 Value (thousands of dollars) Relative Frequency 400 500 600 700 800 900 1,000 1,100 Sample Midrange (thousands of dollars)


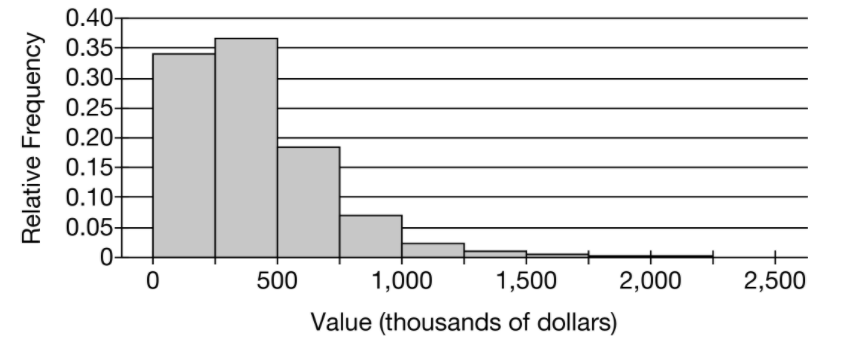
The following histogram shows the distribution of house values in a certain city. The mean of the distribution is $403,000 and the standard deviation is $278,000.
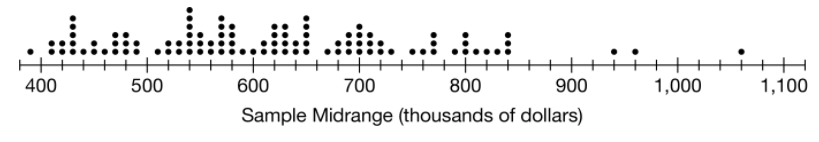
(d) To investigate the sampling distribution of the sample midrange, a simulation is performed in which 100 random samples of size n=40 were selected from the population of house values. For each sample, the sample midrange was calculated and recorded on the following dotplot. The mean of the distribution of sample midranges is $617,000 with standard deviation $136,000.
Based on the results of the simulation, explain why the sample mean might be preferred to the sample midrange as an estimator of the population mean.


Trending now
This is a popular solution!

Step by step
Solved in 2 steps with 1 images


