43.30 53.02 63.52 45.93 48.26 50.51 49.57 43.93 46.77 59.12 54.49 47.38 40.78 45.05 50.37 54.91 51.28 40.01 53.29 67.59 58.71 42.96 55.77 41.31 58.83 48.21 44.67 67.72 43.11 (a) Make a time-series line graph showing the trend of observed rainfall data through time. (For year, just denote it as Year 1, Year 2 etc.). Draw the line graph by hand. (b) Make a grouped data representing the given rainfall data. Use the following class intervals: 40<=X<45, 45<=X<50, 50<=X<55, 55<=X<60, 60<=X<65, and 65<=X<70.
43.30 53.02 63.52 45.93 48.26 50.51 49.57 43.93 46.77 59.12 54.49 47.38 40.78 45.05 50.37 54.91 51.28 40.01 53.29 67.59 58.71 42.96 55.77 41.31 58.83 48.21 44.67 67.72 43.11 (a) Make a time-series line graph showing the trend of observed rainfall data through time. (For year, just denote it as Year 1, Year 2 etc.). Draw the line graph by hand. (b) Make a grouped data representing the given rainfall data. Use the following class intervals: 40<=X<45, 45<=X<50, 50<=X<55, 55<=X<60, 60<=X<65, and 65<=X<70.

Glencoe Algebra 1, Student Edition, 9780079039897, 0079039898, 2018
18th Edition
ISBN:9780079039897
Author:Carter
Publisher:Carter
Chapter10: Statistics
Section10.4: Distributions Of Data
Problem 19PFA

Related questions
Question
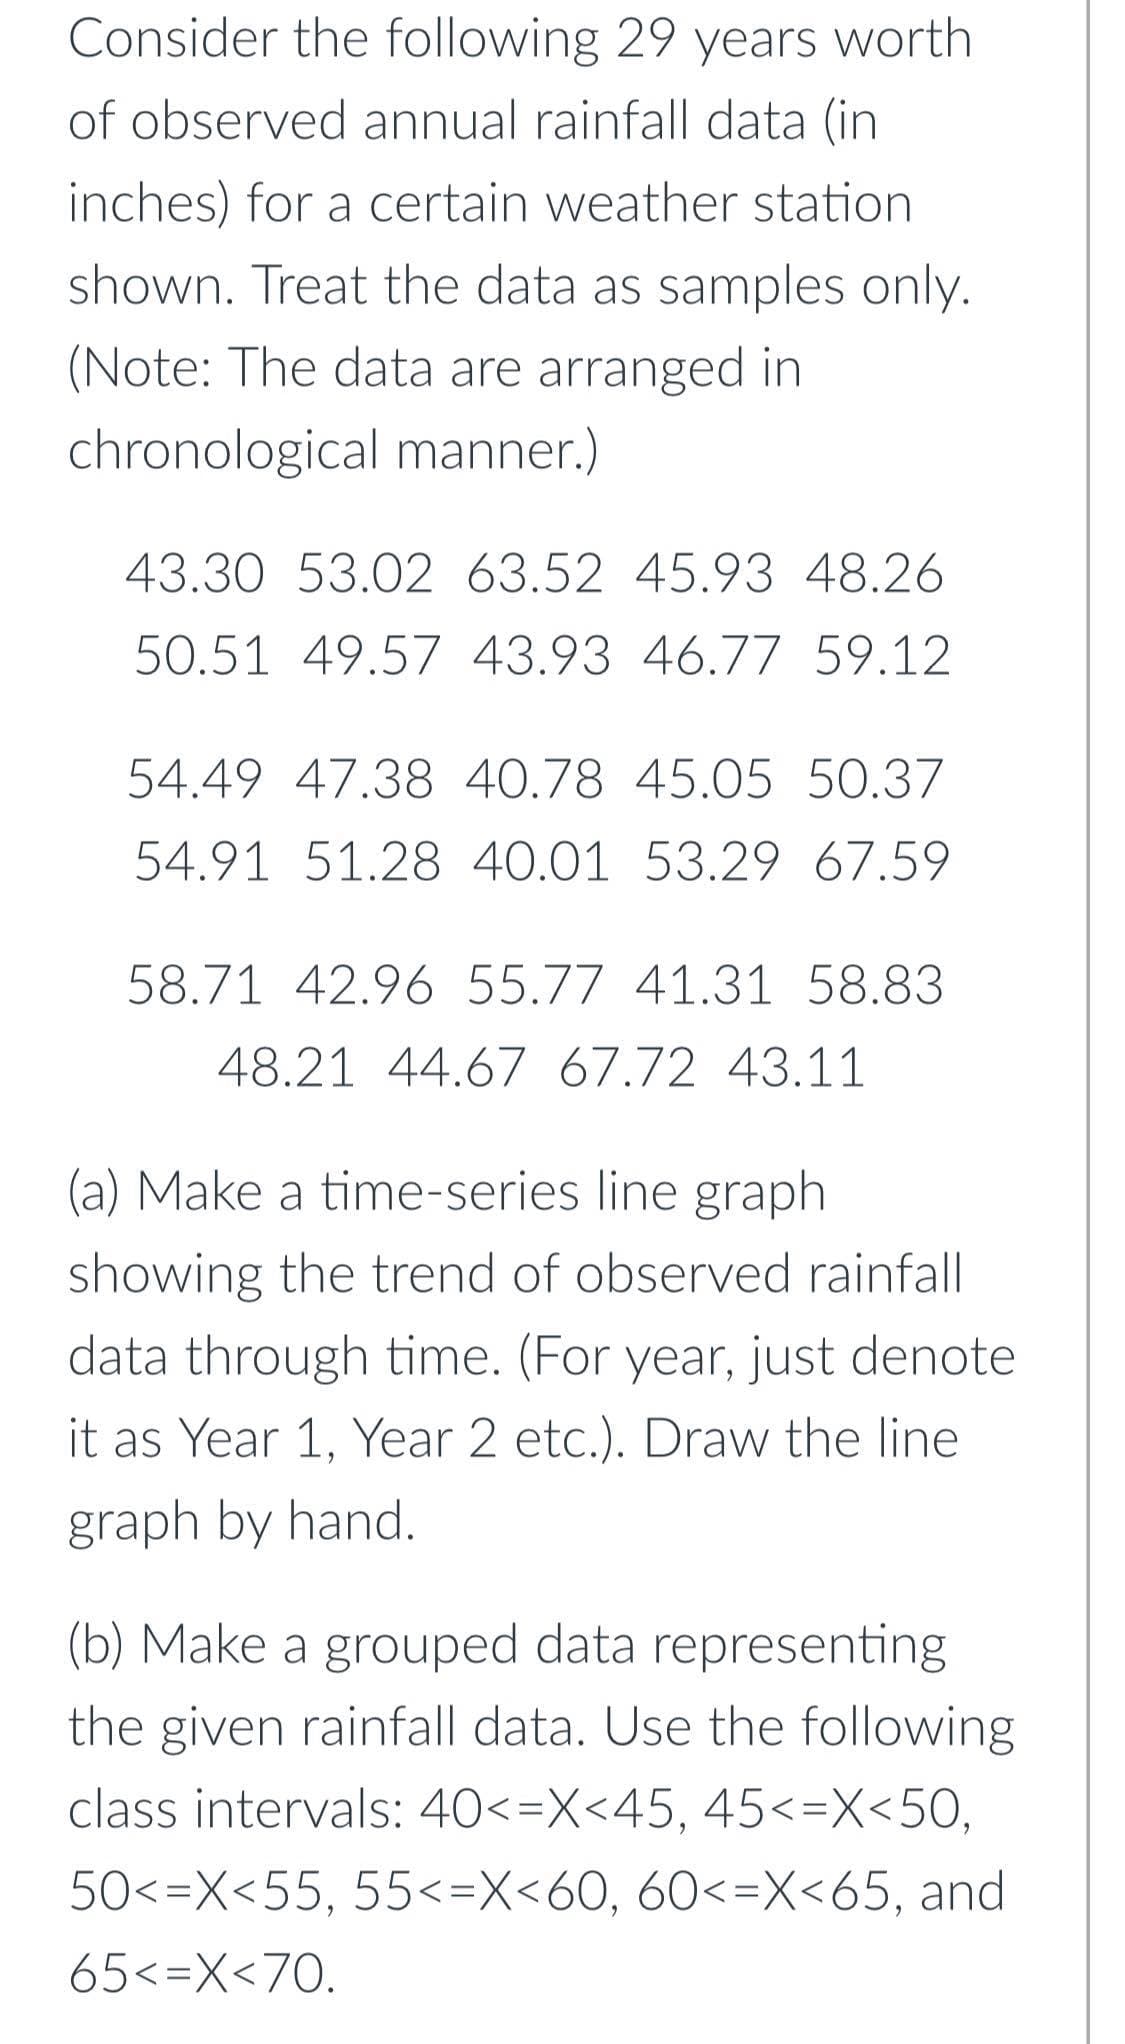
Transcribed Image Text:Consider the following 29 years worth
of observed annual rainfall data (in
inches) for a certain weather station
shown. Treat the data as samples only.
(Note: The data are arranged in
chronological manner.)
43.30 53.02 63.52 45.93 48.26
50.51 49.57 43.93 46.77 59.12
54.49 47.38 40.78 45.05 50.37
54.91 51.28 40.01 53.29 67.59
58.71 42.96 55.77 41.31 58.83
48.21 44.67 67.72 43.11
(a) Make a time-series line graph
showing the trend of observed rainfall
data through time. (For year, just denote
it as Year 1, Year 2 etc.). Draw the line
graph by hand.
(b) Make a grouped data representing
the given rainfall data. Use the following
class intervals: 40<=X<45, 45<=X<50,
50<=X<55, 55<=X<60, 60<=X<65, and
65<=X<70.
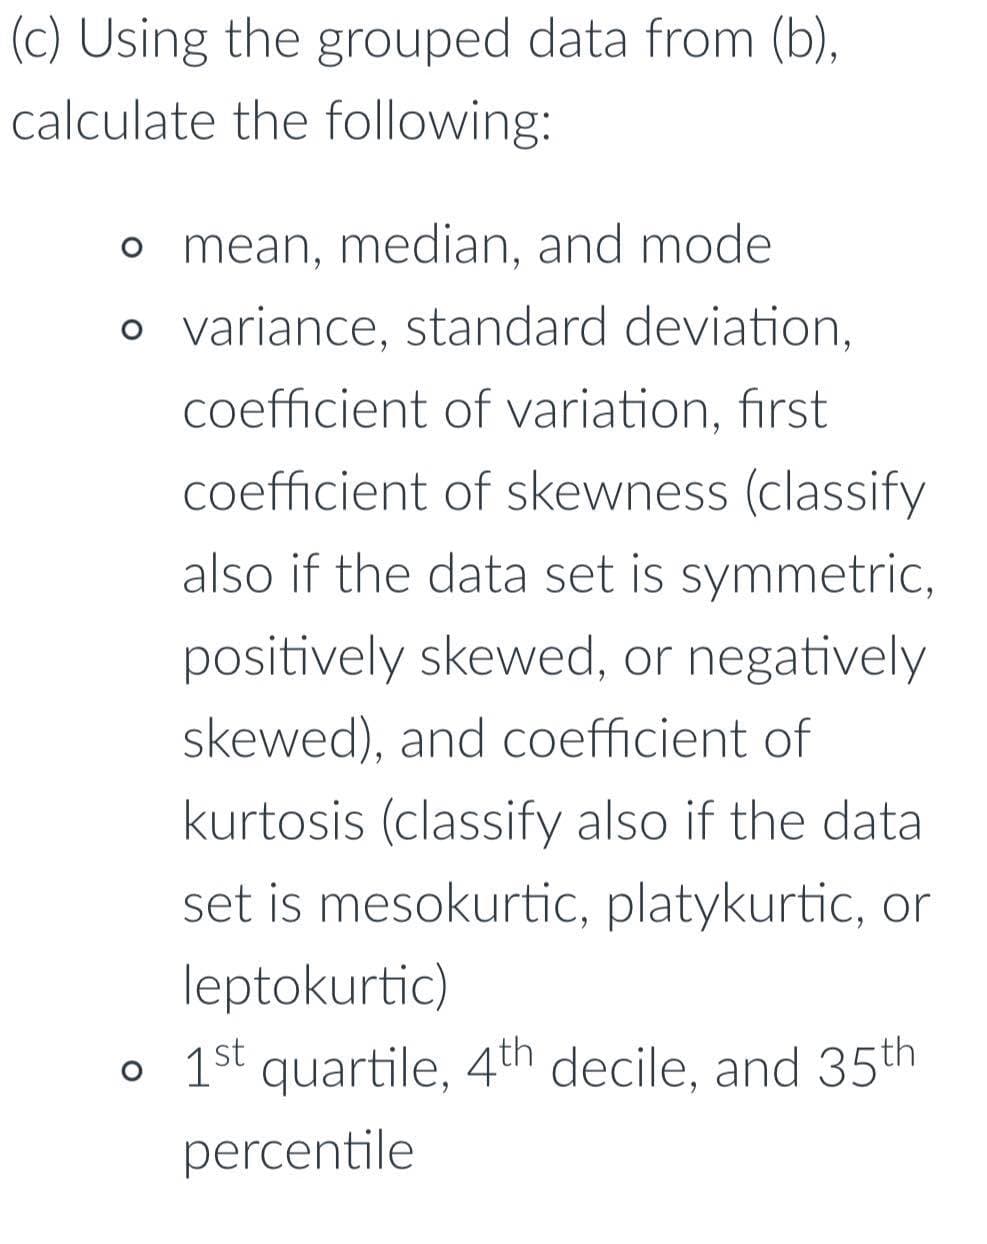
Transcribed Image Text:(c) Using the grouped data from (b),
calculate the following:
o mean, median, and mode
o variance, standard deviation,
coefficient of variation, first
coefficient of skewness (classify
also if the data set is symmetric,
positively skewed, or negatively
skewed), and coefficient of
kurtosis (classify also if the data
set is mesokurtic, platykurtic, or
leptokurtic)
o 1st quartile, 4th decile, and 35th
percentile
Expert Solution
This question has been solved!
Explore an expertly crafted, step-by-step solution for a thorough understanding of key concepts.

Step by step
Solved in 2 steps with 3 images

Recommended textbooks for you
Glencoe Algebra 1, Student Edition, 9780079039897…
Algebra
ISBN:
9780079039897
Author:
Carter
Publisher:
McGraw Hill
Glencoe Algebra 1, Student Edition, 9780079039897…
Algebra
ISBN:
9780079039897
Author:
Carter
Publisher:
McGraw Hill