45 24 28 23 17 17 27 14 23 18 Source: The World Almanac. 24. Consumption of Natural Gas Construct a frequency distribution for the energy consumption of natural gas (in billions of Btu) by the 50 states and the District of Columbia. Use 9 classes. 474 475 205 639 197 344 3 409 247 66 377 87 747 1166 223 248 958 406 251 3462 514 37 2391 1 58 224 530 317 267 769 188 289 76 678 331 52 214 165 255 319 34 1300 284 834 114 1082 73 62 95 39 910 Source: Time Almanac. (etsd evitati t DIRIE abeq dncDi ritinii9urlee tara Extending the Concepts 27. JFK Assassination A researcher conducted a survey s part goes o numbers tha asking people if they believed more than one person was involved in the assassination of John F. Kennedy. part of t to A00 20
45 24 28 23 17 17 27 14 23 18 Source: The World Almanac. 24. Consumption of Natural Gas Construct a frequency distribution for the energy consumption of natural gas (in billions of Btu) by the 50 states and the District of Columbia. Use 9 classes. 474 475 205 639 197 344 3 409 247 66 377 87 747 1166 223 248 958 406 251 3462 514 37 2391 1 58 224 530 317 267 769 188 289 76 678 331 52 214 165 255 319 34 1300 284 834 114 1082 73 62 95 39 910 Source: Time Almanac. (etsd evitati t DIRIE abeq dncDi ritinii9urlee tara Extending the Concepts 27. JFK Assassination A researcher conducted a survey s part goes o numbers tha asking people if they believed more than one person was involved in the assassination of John F. Kennedy. part of t to A00 20

Glencoe Algebra 1, Student Edition, 9780079039897, 0079039898, 2018
18th Edition
ISBN:9780079039897
Author:Carter
Publisher:Carter
Chapter10: Statistics
Section: Chapter Questions
Problem 26SGR

Related questions

Concept explainers
Contingency Table
A contingency table can be defined as the visual representation of the relationship between two or more categorical variables that can be evaluated and registered. It is a categorical version of the scatterplot, which is used to investigate the linear relationship between two variables. A contingency table is indeed a type of frequency distribution table that displays two variables at the same time.
Binomial Distribution
Binomial is an algebraic expression of the sum or the difference of two terms. Before knowing about binomial distribution, we must know about the binomial theorem.
Topic Video
Question
100%
Problem 24
Transcribed Image Text:45 24 28 23 17 17 27 14 23 18
Source: The World Almanac.
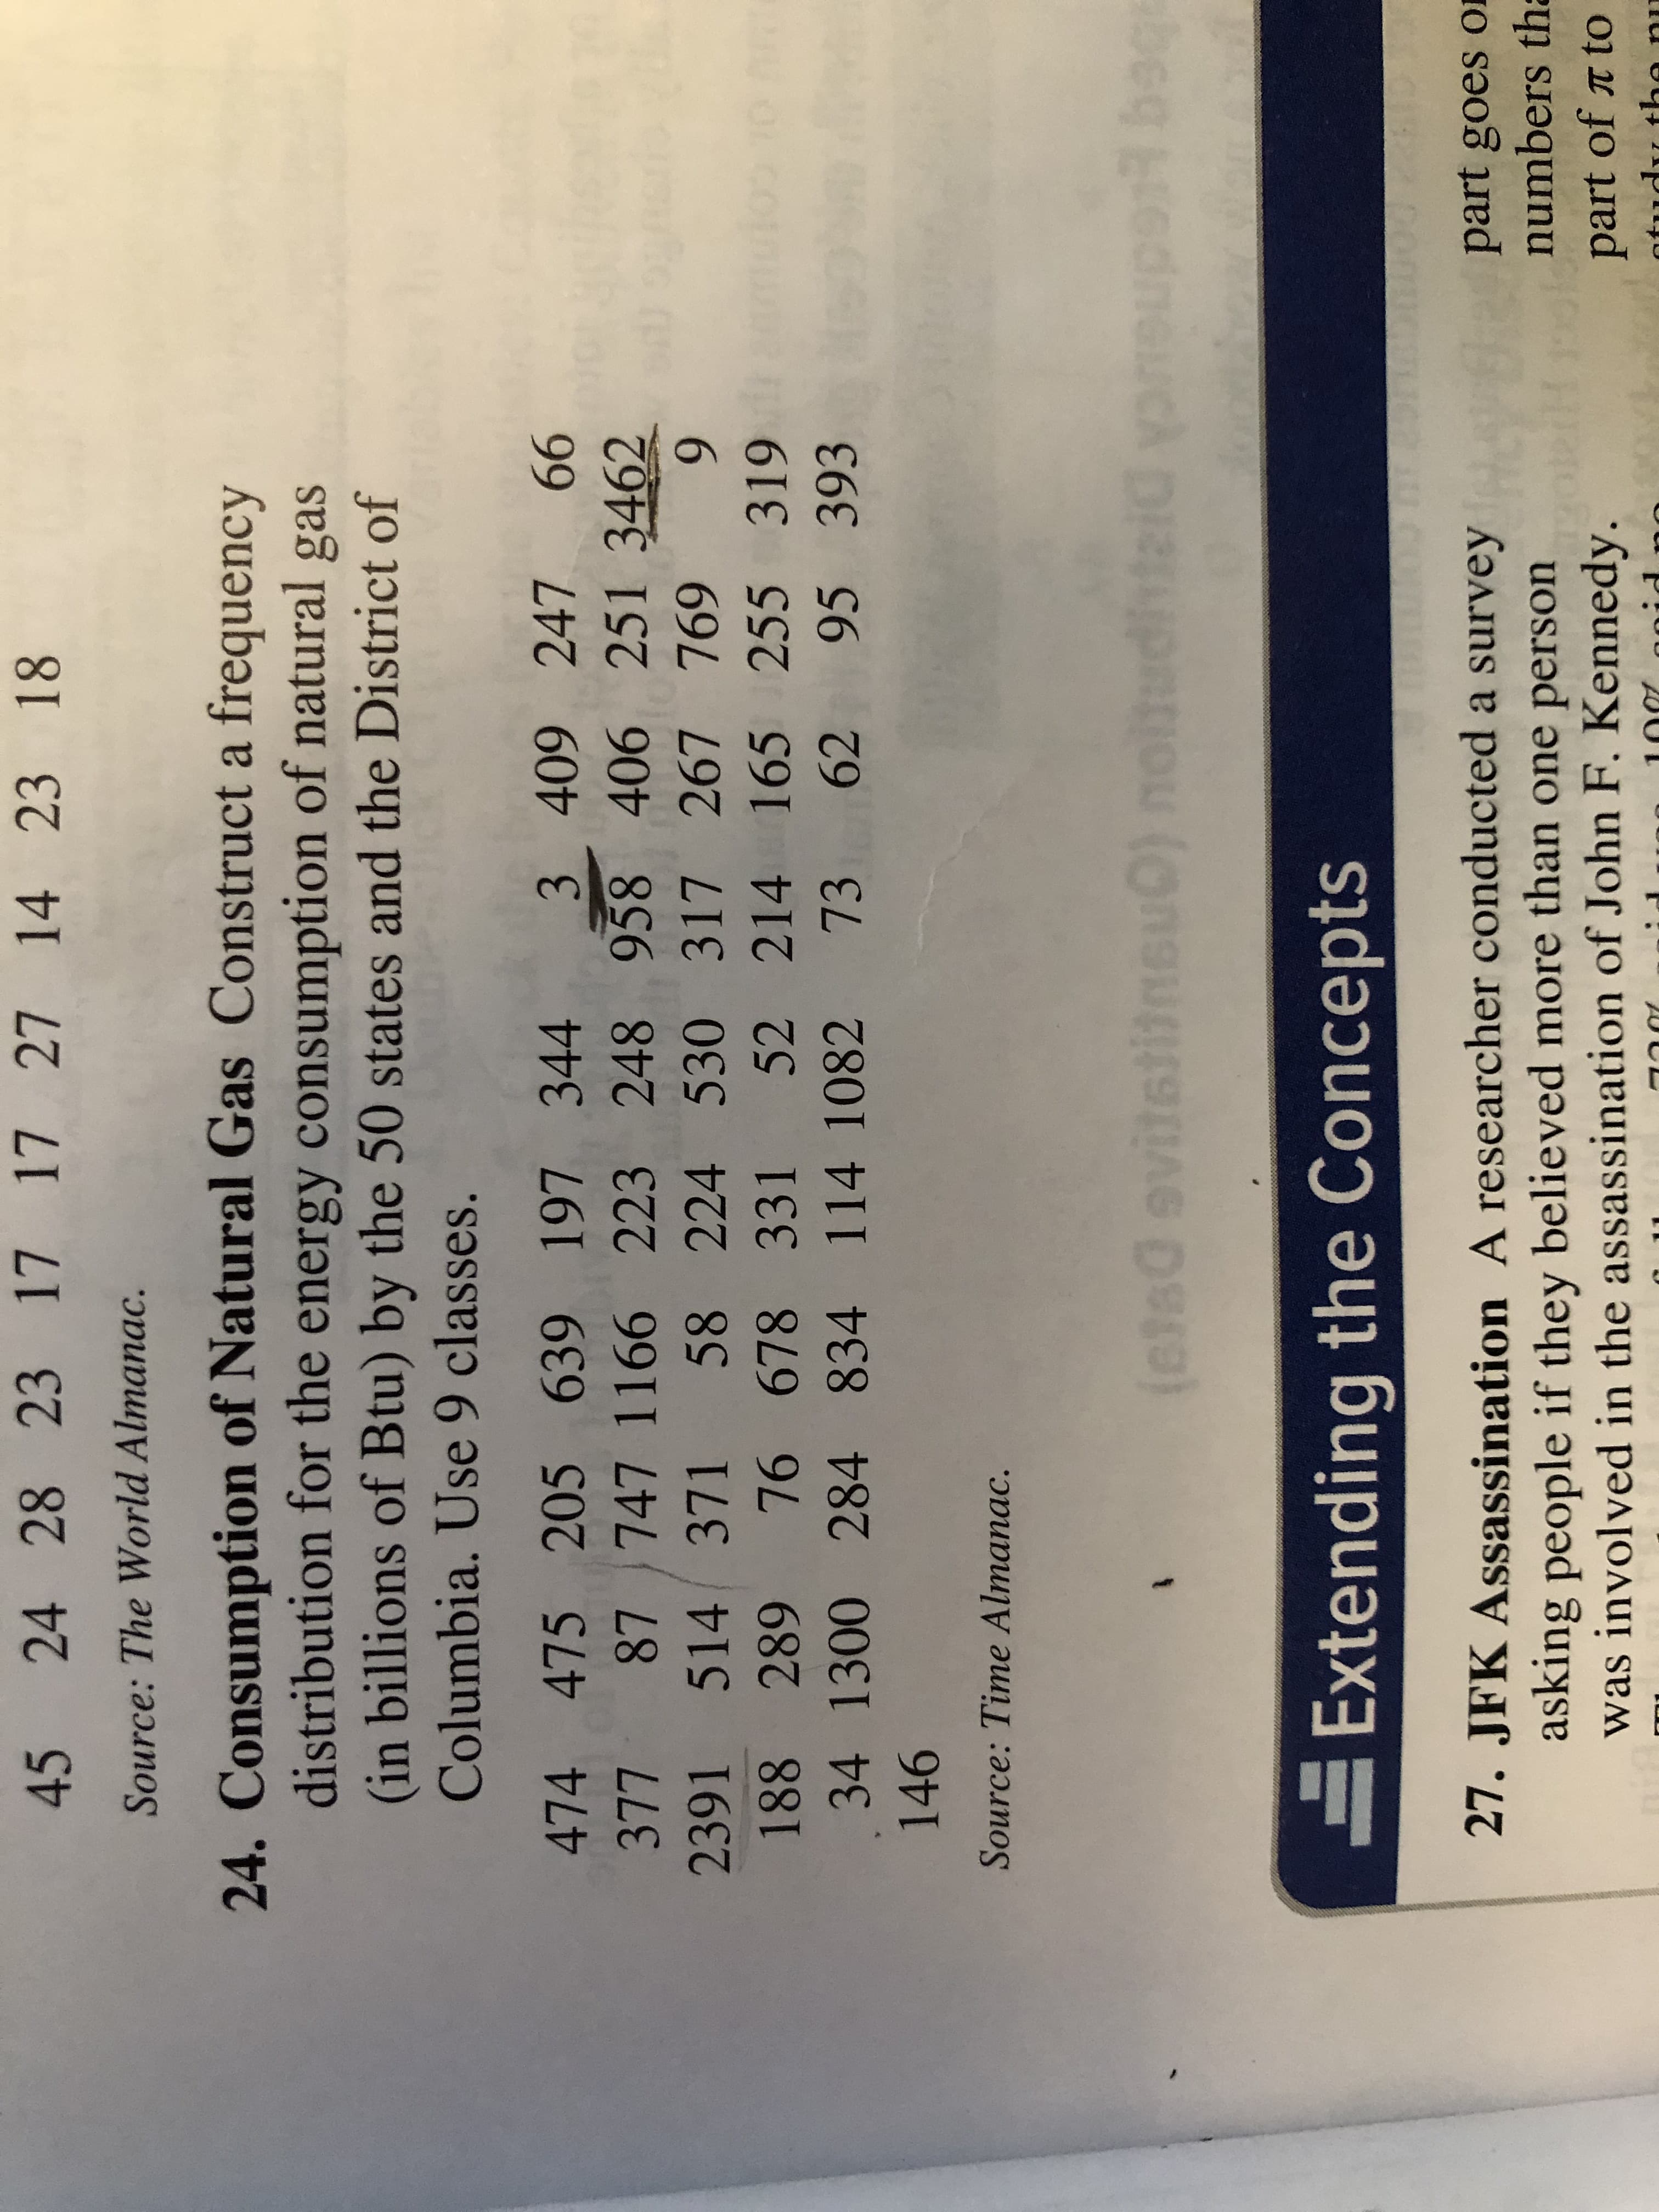
24. Consumption of Natural Gas Construct a frequency
distribution for the energy consumption of natural gas
(in billions of Btu) by the 50 states and the District of
Columbia. Use 9 classes.
474 475 205 639 197 344
3 409 247 66
377 87 747 1166 223 248 958 406 251 3462
514 37
2391 1
58 224 530 317 267 769
188 289 76 678 331 52 214 165 255 319
34 1300 284 834 114 1082 73 62 95 39
910
Source: Time Almanac.
(etsd evitati
t
DIRIE
abeq dncDi ritinii9urlee tara
Extending the Concepts
27. JFK Assassination A researcher conducted a survey s
part goes o
numbers tha
asking people if they believed more than one person
was involved in the assassination of John F. Kennedy.
part of t to
A00
20
Expert Solution
This question has been solved!
Explore an expertly crafted, step-by-step solution for a thorough understanding of key concepts.

This is a popular solution!

Trending now
This is a popular solution!

Step by step
Solved in 3 steps with 1 images

Knowledge Booster


Learn more about
Need a deep-dive on the concept behind this application? Look no further. Learn more about this topic, statistics and related others by exploring similar questions and additional content below.Recommended textbooks for you
Glencoe Algebra 1, Student Edition, 9780079039897…
Algebra
ISBN:
9780079039897
Author:
Carter
Publisher:
McGraw Hill

Linear Algebra: A Modern Introduction
Algebra
ISBN:
9781285463247
Author:
David Poole
Publisher:
Cengage Learning

Algebra & Trigonometry with Analytic Geometry
Algebra
ISBN:
9781133382119
Author:
Swokowski
Publisher:
Cengage
Glencoe Algebra 1, Student Edition, 9780079039897…
Algebra
ISBN:
9780079039897
Author:
Carter
Publisher:
McGraw Hill
Linear Algebra: A Modern Introduction
Algebra
ISBN:
9781285463247
Author:
David Poole
Publisher:
Cengage Learning
Algebra & Trigonometry with Analytic Geometry
Algebra
ISBN:
9781133382119
Author:
Swokowski
Publisher:
Cengage

Algebra: Structure And Method, Book 1
Algebra
ISBN:
9780395977224
Author:
Richard G. Brown, Mary P. Dolciani, Robert H. Sorgenfrey, William L. Cole
Publisher:
McDougal Littell