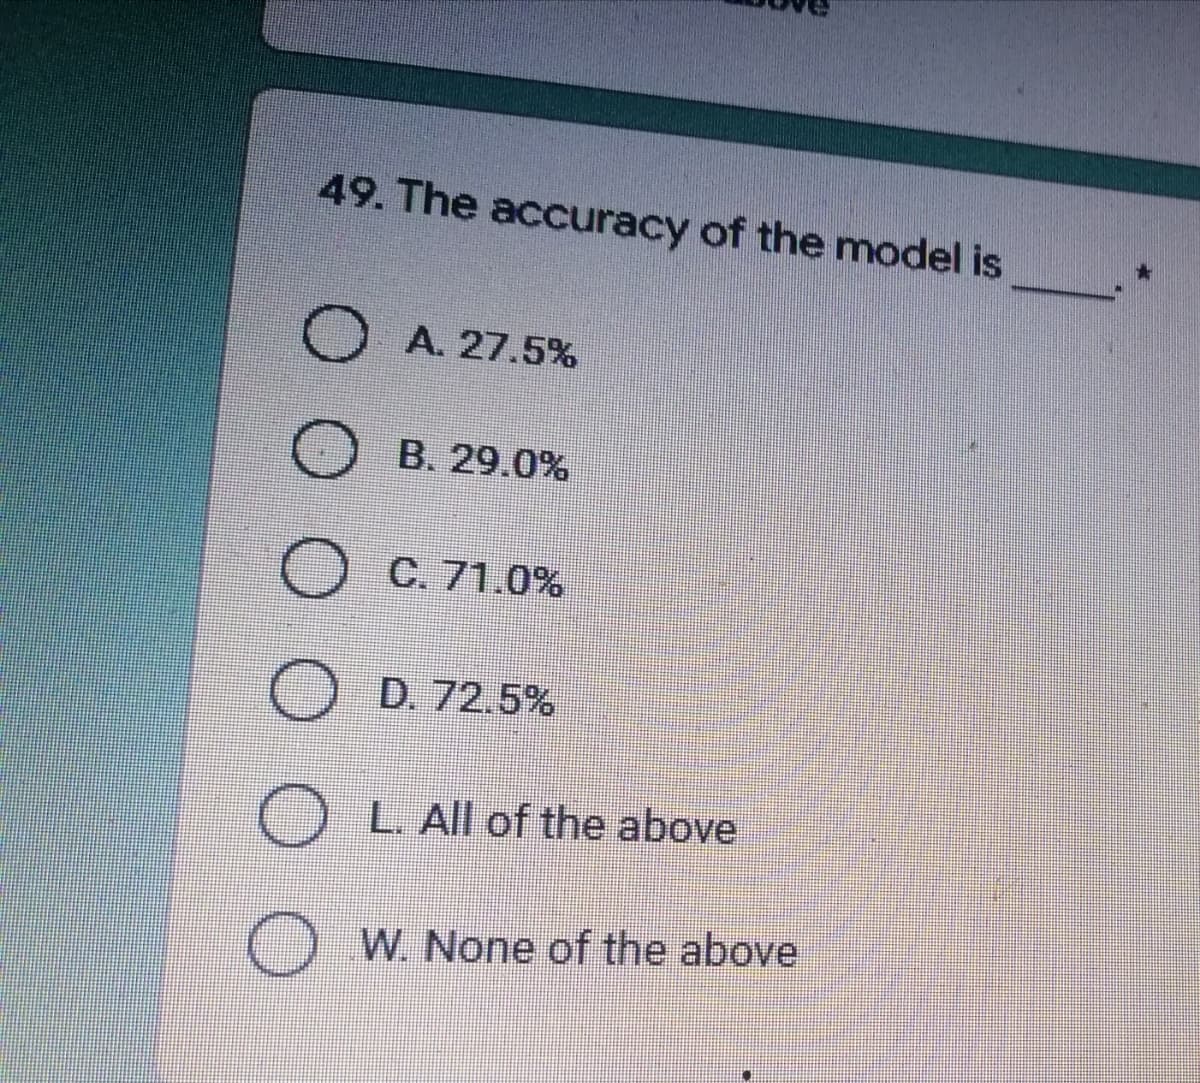
49. The accuracy of the model is OA. 27.5% B. 29.0% O C. 71.0% O D. 72.5% OL. All of the above W. None of the above
49. The accuracy of the model is OA. 27.5% B. 29.0% O C. 71.0% O D. 72.5% OL. All of the above W. None of the above

MATLAB: An Introduction with Applications
6th Edition
ISBN:9781119256830
Author:Amos Gilat
Publisher:Amos Gilat
Chapter1: Starting With Matlab
Section: Chapter Questions
Problem 1P

Related questions
Question
49
Transcribed Image Text:49. The accuracy of the model is
O A. 27.5%
B. 29.0%
O
C. 71.0%
O D. 72.5%
OL. All of the above
OW. None of the above
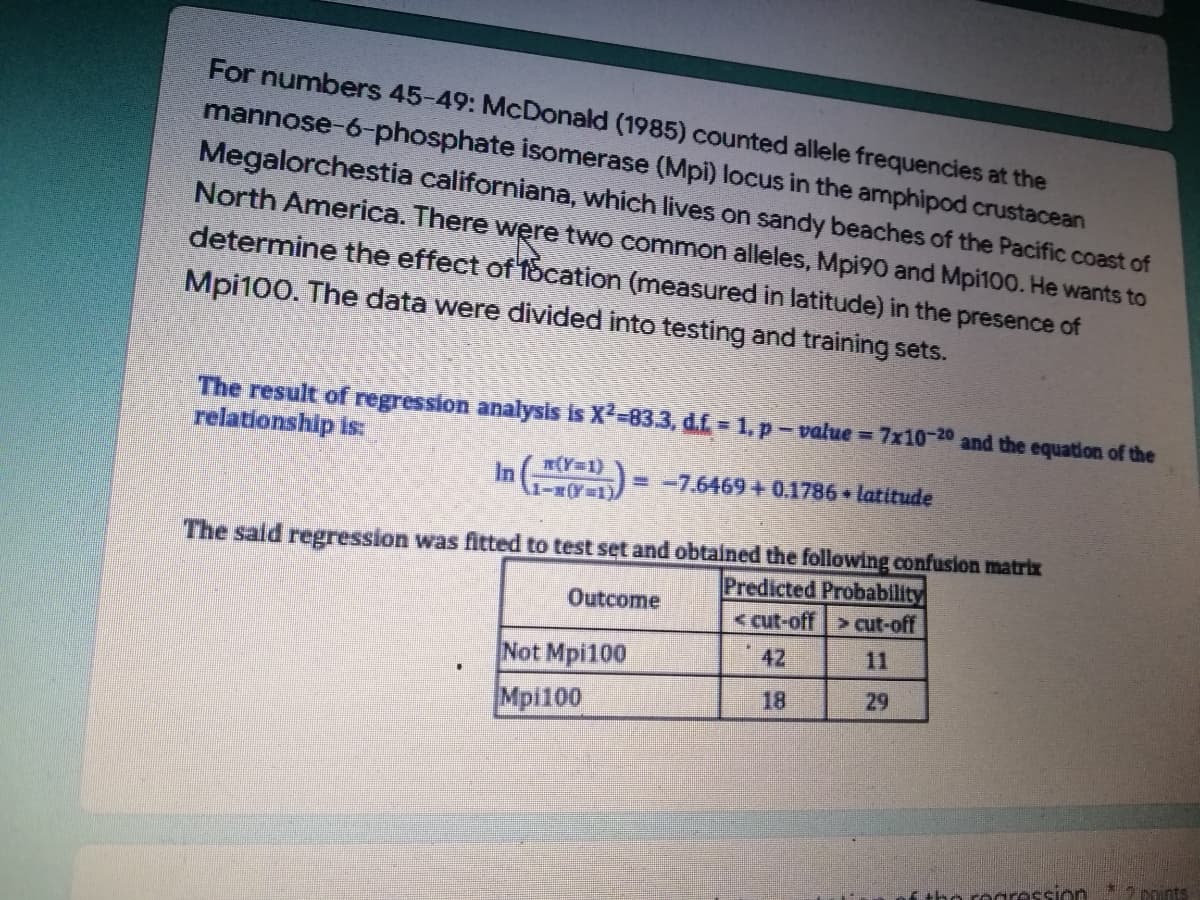
Transcribed Image Text:For numbers 45-49: McDonald (1985) counted allele frequencies at the
mannose-6-phosphate isomerase (Mpi) locus in the amphipod crustacean
Megalorchestia californiana, which lives on sandy beaches of the Pacific coast of
North America. There were two common alleles, Mpi90 and Mpi100. He wants to
determine the effect of focation (measured in latitude) in the presence of
Mpi100. The data were divided into testing and training sets.
The result of regression analysis is X²=83.3, d.f. = 1, p – value = 7x10-20 and the equation of the
relationship is:
= -7.6469 + 0.1786 latitude
(Y=1)
In 1-3 (Y=1)
The said regression was fitted to test set and obtained the following confusion matrix
Predicted Probability
Outcome
< cut-off > cut-off
42
Not Mpi100
Mpi100
18
29
the regression
2 points
Expert Solution
This question has been solved!
Explore an expertly crafted, step-by-step solution for a thorough understanding of key concepts.

Step by step
Solved in 2 steps with 1 images

Recommended textbooks for you
MATLAB: An Introduction with Applications
Statistics
ISBN:
9781119256830
Author:
Amos Gilat
Publisher:
John Wiley & Sons Inc

Probability and Statistics for Engineering and th…
Statistics
ISBN:
9781305251809
Author:
Jay L. Devore
Publisher:
Cengage Learning

Statistics for The Behavioral Sciences (MindTap C…
Statistics
ISBN:
9781305504912
Author:
Frederick J Gravetter, Larry B. Wallnau
Publisher:
Cengage Learning
MATLAB: An Introduction with Applications
Statistics
ISBN:
9781119256830
Author:
Amos Gilat
Publisher:
John Wiley & Sons Inc
Probability and Statistics for Engineering and th…
Statistics
ISBN:
9781305251809
Author:
Jay L. Devore
Publisher:
Cengage Learning
Statistics for The Behavioral Sciences (MindTap C…
Statistics
ISBN:
9781305504912
Author:
Frederick J Gravetter, Larry B. Wallnau
Publisher:
Cengage Learning

Elementary Statistics: Picturing the World (7th E…
Statistics
ISBN:
9780134683416
Author:
Ron Larson, Betsy Farber
Publisher:
PEARSON

The Basic Practice of Statistics
Statistics
ISBN:
9781319042578
Author:
David S. Moore, William I. Notz, Michael A. Fligner
Publisher:
W. H. Freeman

Introduction to the Practice of Statistics
Statistics
ISBN:
9781319013387
Author:
David S. Moore, George P. McCabe, Bruce A. Craig
Publisher:
W. H. Freeman