5) Interpreting Data: For the following question, consider the table and graph presented below. p24 pg/ml B10? A V3 amino acid sequence molecular clone 296 306 317 320 324 charge* SI phenotype** 10 168.1 CTRPNNNTRKSIHIGPGRAFYATGDIIGDIRQAHC 3+ 168.10 6+ Mutagenesis set 10° X. 168.1/RT 4+ * *** ...- 168.1/RQ --Q-- 10 5+ 168.1/RN -R- -N------ 5+ 168.1/RTQ 5+ 103 + .--- 168.1/RTN T---N------ 5+ + 168.1/RON -0---N------ 6+ 102 10 2 4 6 10 12 14 days after transfection Table SEQ Table * ARABIC 3 and Graph 2 All the lines on the graph represent the effect of one molecular clone. What molecular clone does line X lescribe? How did come to such a conclusion? Answer: Line X is Molecular clone is the negative control group. We came to this conclusion because the egative control groun is the only one with 3+ charợe and a negative SI phenotype
5) Interpreting Data: For the following question, consider the table and graph presented below. p24 pg/ml B10? A V3 amino acid sequence molecular clone 296 306 317 320 324 charge* SI phenotype** 10 168.1 CTRPNNNTRKSIHIGPGRAFYATGDIIGDIRQAHC 3+ 168.10 6+ Mutagenesis set 10° X. 168.1/RT 4+ * *** ...- 168.1/RQ --Q-- 10 5+ 168.1/RN -R- -N------ 5+ 168.1/RTQ 5+ 103 + .--- 168.1/RTN T---N------ 5+ + 168.1/RON -0---N------ 6+ 102 10 2 4 6 10 12 14 days after transfection Table SEQ Table * ARABIC 3 and Graph 2 All the lines on the graph represent the effect of one molecular clone. What molecular clone does line X lescribe? How did come to such a conclusion? Answer: Line X is Molecular clone is the negative control group. We came to this conclusion because the egative control groun is the only one with 3+ charợe and a negative SI phenotype

Biochemistry
6th Edition
ISBN:9781305577206
Author:Reginald H. Garrett, Charles M. Grisham
Publisher:Reginald H. Garrett, Charles M. Grisham
Chapter30: Protein Synthesis
Section: Chapter Questions
Problem 1P

Related questions

Question
please asap
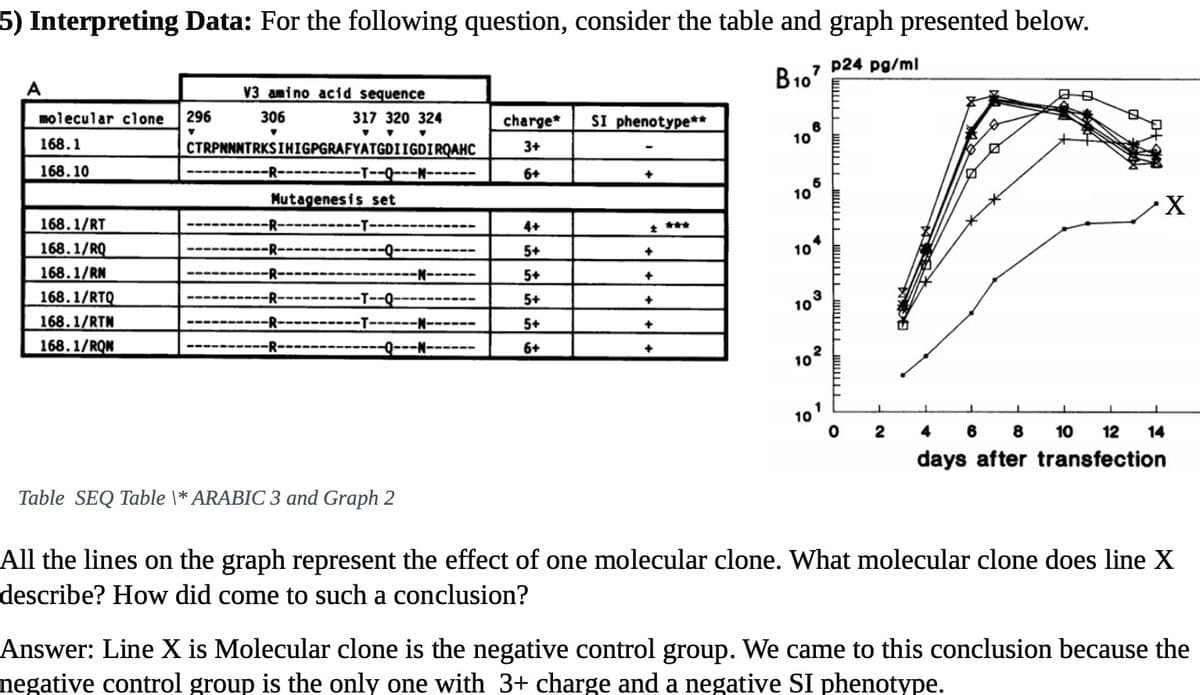
Transcribed Image Text:5) Interpreting Data: For the following question, consider the table and graph presented below.
A
V3 amino acid sequence
B10?
7 p24 pg/ml
molecular clone
296
306
317 320 324
只日
charge*
SI phenotype**
168.1
CTRPNNNTRKSIHIGPGRAFYATGDIIGDIRQAHC
3+
168.10
---T--Q---N-
6+
Mutagenesis set
5
10
168.1/RT
--T----
4+
***
168.1/RQ
-R-
5+
104
168.1/RN
-N-
5+
+
168.1/RTQ
-T--Q-
-T--
5+
+
168.1/RTN
168.1/RQN
-R
103
----
5+
-R-
-Q---N------
6+
102
101
4 6
8
10
12
14
days after transfection
Table SEQ Table \* ARABIC 3 and Graph 2
All the lines on the graph represent the effect of one molecular clone. What molecular clone does line X
describe? How did come to such a conclusion?
Answer: Line X is Molecular clone is the negative control group. We came to this conclusion because the
negative control group is the only one with 3+ charge and a negative SI phenotype.
Expert Solution
This question has been solved!
Explore an expertly crafted, step-by-step solution for a thorough understanding of key concepts.

This is a popular solution!

Trending now
This is a popular solution!

Step by step
Solved in 2 steps

Knowledge Booster


Learn more about
Need a deep-dive on the concept behind this application? Look no further. Learn more about this topic, biology and related others by exploring similar questions and additional content below.Recommended textbooks for you
Biochemistry
Biochemistry
ISBN:
9781305577206
Author:
Reginald H. Garrett, Charles M. Grisham
Publisher:
Cengage Learning

Biology: The Dynamic Science (MindTap Course List)
Biology
ISBN:
9781305389892
Author:
Peter J. Russell, Paul E. Hertz, Beverly McMillan
Publisher:
Cengage Learning
Biochemistry
Biochemistry
ISBN:
9781305577206
Author:
Reginald H. Garrett, Charles M. Grisham
Publisher:
Cengage Learning
Biology: The Dynamic Science (MindTap Course List)
Biology
ISBN:
9781305389892
Author:
Peter J. Russell, Paul E. Hertz, Beverly McMillan
Publisher:
Cengage Learning