5. A higher-education consultant wanted to see whether a university computer help desk had sufficient resources to assist faculty with computer problems. The consultant randomly sampled 200 faculty members. To determine the factors that influence waiting time, he estimated a simple regression model and got the following results: Wâit = 45- 7Staff (50) (3.2) n=200 R2= 0.850 (standard errors of the coefficients are in parentheses beneath the coefficient estimates) where Wait = waiting time in minutes and Staff = the number of staff working at the help desk. a. Clearly explain, in words, the meaning of the following statistics: coefficient estimates, standard errors of the coefficients, R2.
5. A higher-education consultant wanted to see whether a university computer help desk had sufficient resources to assist faculty with computer problems. The consultant randomly sampled 200 faculty members. To determine the factors that influence waiting time, he estimated a simple regression model and got the following results: Wâit = 45- 7Staff (50) (3.2) n=200 R2= 0.850 (standard errors of the coefficients are in parentheses beneath the coefficient estimates) where Wait = waiting time in minutes and Staff = the number of staff working at the help desk. a. Clearly explain, in words, the meaning of the following statistics: coefficient estimates, standard errors of the coefficients, R2.

Linear Algebra: A Modern Introduction
4th Edition
ISBN:9781285463247
Author:David Poole
Publisher:David Poole
Chapter7: Distance And Approximation
Section7.3: Least Squares Approximation
Problem 31EQ

Related questions
Question
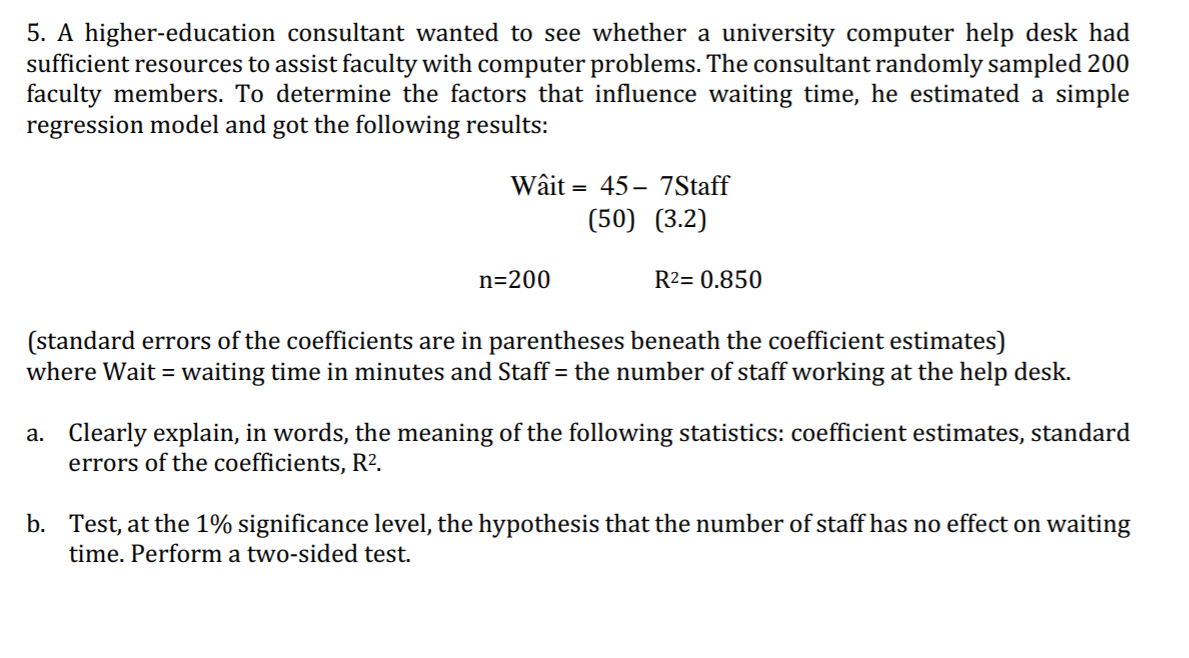
Transcribed Image Text:5. A higher-education consultant wanted to see whether a university computer help desk had
sufficient resources to assist faculty with computer problems. The consultant randomly sampled 200
faculty members. To determine the factors that influence waiting time, he estimated a simple
regression model and got the following results:
Wâit
= 45 – 7Staff
(50) (3.2)
n=200
R2= 0.850
(standard errors of the coefficients are in parentheses beneath the coefficient estimates)
where Wait = waiting time in minutes and Staff = the number of staff working at the help desk.
a. Clearly explain, in words, the meaning of the following statistics: coefficient estimates, standard
errors of the coefficients, R2.
b. Test, at the 1% significance level, the hypothesis that the number of staff has no effect on waiting
time. Perform a two-sided test.
Expert Solution
This question has been solved!
Explore an expertly crafted, step-by-step solution for a thorough understanding of key concepts.

This is a popular solution!

Trending now
This is a popular solution!

Step by step
Solved in 2 steps with 3 images

Recommended textbooks for you
Linear Algebra: A Modern Introduction
Algebra
ISBN:
9781285463247
Author:
David Poole
Publisher:
Cengage Learning
Linear Algebra: A Modern Introduction
Algebra
ISBN:
9781285463247
Author:
David Poole
Publisher:
Cengage Learning