5. A researcher estimates that the average height of buildings in terms of the number of storey in the National Capital Region is at least 15 storeys. A random sample of 12 building is selected, and the numbers of storey are shown. At a = 0.01, is there enough evidence to reject the claim? 17 20 36 10 35 15 28 25 30 12 16 Solution: Step 1: State the hypotheses. H. H Step 2: The level of sigificance is , and df = Step 3: Determine the critical region. tawa" Step 4: Complete the table and compute for the value of sample mean, standard deviation and one sample t test. X-X X-X (X-X (x–X' 20 10 40 35 12 15 17 28 16 25 30 Step 5: Decision rule. Step 6: Conclusion.
5. A researcher estimates that the average height of buildings in terms of the number of storey in the National Capital Region is at least 15 storeys. A random sample of 12 building is selected, and the numbers of storey are shown. At a = 0.01, is there enough evidence to reject the claim? 17 20 36 10 35 15 28 25 30 12 16 Solution: Step 1: State the hypotheses. H. H Step 2: The level of sigificance is , and df = Step 3: Determine the critical region. tawa" Step 4: Complete the table and compute for the value of sample mean, standard deviation and one sample t test. X-X X-X (X-X (x–X' 20 10 40 35 12 15 17 28 16 25 30 Step 5: Decision rule. Step 6: Conclusion.

College Algebra (MindTap Course List)
12th Edition
ISBN:9781305652231
Author:R. David Gustafson, Jeff Hughes
Publisher:R. David Gustafson, Jeff Hughes
Chapter8: Sequences, Series, And Probability
Section8.7: Probability
Problem 58E: What is meant by the sample space of an experiment?

Related questions
Topic Video
Question
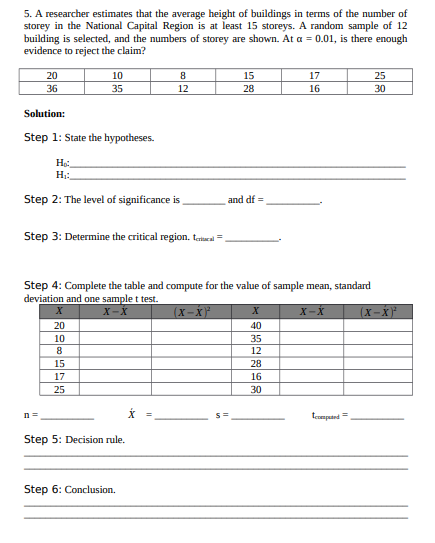
Transcribed Image Text:5. A researcher estimates that the average height of buildings in terms of the number of
storey in the National Capital Region is at least 15 storeys. A random sample of 12
building is selected, and the numbers of storey are shown. At a = 0.01, is there enough
evidence to reject the claim?
20
10
8
15
17
25
36
35
12
28
16
30
Solution:
Step 1: State the hypotheses.
Step 2: The level of significance is
and df =
Step 3: Determine the critical region. tatal
Step 4: Complete the table and compute for the value of sample mean, standard
deviation and one sample t test.
X-X
(x-x)
X-X
(x-x)
20
40
10
35
12
15
28
17
16
25
30
n =
temputnd =
Step 5: Decision rule.
Step 6: Conclusion.
Expert Solution
This question has been solved!
Explore an expertly crafted, step-by-step solution for a thorough understanding of key concepts.

This is a popular solution!

Trending now
This is a popular solution!

Step by step
Solved in 3 steps

Knowledge Booster


Learn more about
Need a deep-dive on the concept behind this application? Look no further. Learn more about this topic, statistics and related others by exploring similar questions and additional content below.Recommended textbooks for you
College Algebra (MindTap Course List)
Algebra
ISBN:
9781305652231
Author:
R. David Gustafson, Jeff Hughes
Publisher:
Cengage Learning
College Algebra (MindTap Course List)
Algebra
ISBN:
9781305652231
Author:
R. David Gustafson, Jeff Hughes
Publisher:
Cengage Learning