5. Elasticity and total revenue The following graph shows the dally demand curve for bikes in Miami. Use the green rectangle (triangle symbols) to compute total revenue at vanious prices along the demand curve. Note: You will not be graded on any changes made to this graph. 300 275 250 Total Revenue 225 200 夏175 100 125 100 75 60 25 Demand 5 10 15 20 25 30 35 40 45 50 55 60 QUANTITY (Bikas) On the following graph, use the green point (triangle symbol) to plot the annual total revenue when the market price is $50, $75, $100, $125, $150, $175, and $200 per bike. 5300 4000 Total Revenue 4500 400 w 3700 2300 2900 2500 200 1700 O 25 se 75 100 125 150 175 20o 225 250 275 300 PRICE (Dollars per bike) According to the midpoint method, the price elasticity of demand between points A and B is approximately . Suppose the price of bikes is currently $100 per bike, shown as point B on the initial graph. Because the demand between points A and B is va $25-per-bike increase in price will lead to in total revenue per day. In general, in order for a price decrease to cause a decrease in total revenue, demand must be TOTAL REVENUE (Dollars) PRICE (Dolars per bike)
5. Elasticity and total revenue The following graph shows the dally demand curve for bikes in Miami. Use the green rectangle (triangle symbols) to compute total revenue at vanious prices along the demand curve. Note: You will not be graded on any changes made to this graph. 300 275 250 Total Revenue 225 200 夏175 100 125 100 75 60 25 Demand 5 10 15 20 25 30 35 40 45 50 55 60 QUANTITY (Bikas) On the following graph, use the green point (triangle symbol) to plot the annual total revenue when the market price is $50, $75, $100, $125, $150, $175, and $200 per bike. 5300 4000 Total Revenue 4500 400 w 3700 2300 2900 2500 200 1700 O 25 se 75 100 125 150 175 20o 225 250 275 300 PRICE (Dollars per bike) According to the midpoint method, the price elasticity of demand between points A and B is approximately . Suppose the price of bikes is currently $100 per bike, shown as point B on the initial graph. Because the demand between points A and B is va $25-per-bike increase in price will lead to in total revenue per day. In general, in order for a price decrease to cause a decrease in total revenue, demand must be TOTAL REVENUE (Dollars) PRICE (Dolars per bike)

Essentials of Economics (MindTap Course List)
8th Edition
ISBN:9781337091992
Author:N. Gregory Mankiw
Publisher:N. Gregory Mankiw
Chapter5: Elastic And Its Application
Section: Chapter Questions
Problem 8PA: The New York Times reported (Feb. 17, 1996) that subway ridership declined after a fare increase:...

Related questions
Question
Transcribed Image Text:5. Elasticity and total revenue
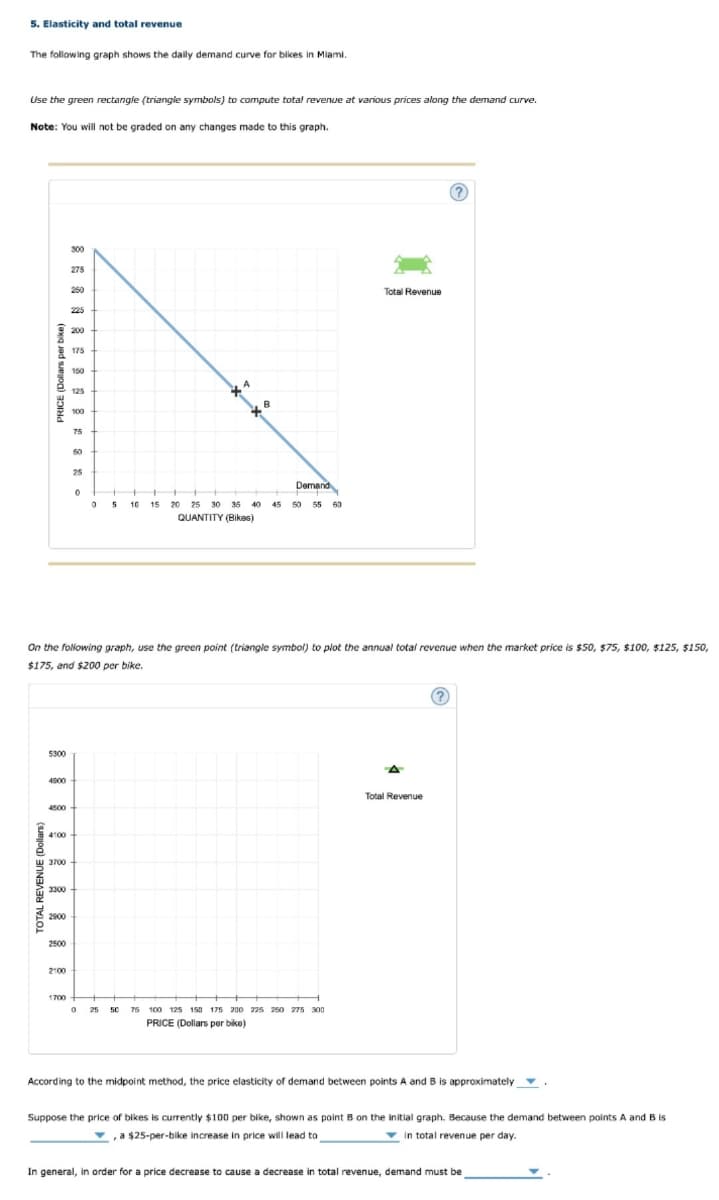
The following graph shows the daily demand curve for bikes in Miami.
.
Use the green rectangle (triangle symbols) to compute total revenue at various prices along the demand curve.
Note: You will not be graded on any changes made to this graph.
300
275
250
Total Revenue
225
200
A 175
150
125
100
75
50
25
Demand
10
15 20 25
30 35 40 45 50 55 60
QUANTITY (Bikes)
On the folowing graph, use the green point (triangle symbol) to plot the annual total revenue when the market price is $50, $75, $100, $125, $150,
$175, and $200 per bike.
5300
4500
Total Revenue
4500
400
W 3700
3300
2900
2500
2100
1700
25
50
75 100 125 150 175 200 225 250 275 300
PRICE (Dollars per bike)
According to the midpoint method, the price elasticity of demand between points A and B is approximately
Suppose the price of bikes is currently $100 per bike, shown as point B on the initial graph. Because the demand between points A and B is
va $25-per-bike increase in price will lead to
v in total revenue per day.
In general, in order for a price decrease to cause a decrease in total revenue, demand must be
TOTAL REVENUE (Dollars)
PRICE (Dollars per bike)
Expert Solution
This question has been solved!
Explore an expertly crafted, step-by-step solution for a thorough understanding of key concepts.

This is a popular solution!

Trending now
This is a popular solution!

Step by step
Solved in 3 steps

Knowledge Booster


Learn more about
Need a deep-dive on the concept behind this application? Look no further. Learn more about this topic, economics and related others by exploring similar questions and additional content below.Recommended textbooks for you
Essentials of Economics (MindTap Course List)
Economics
ISBN:
9781337091992
Author:
N. Gregory Mankiw
Publisher:
Cengage Learning

Principles of Microeconomics (MindTap Course List)
Economics
ISBN:
9781305971493
Author:
N. Gregory Mankiw
Publisher:
Cengage Learning

Principles of Economics (MindTap Course List)
Economics
ISBN:
9781305585126
Author:
N. Gregory Mankiw
Publisher:
Cengage Learning
Essentials of Economics (MindTap Course List)
Economics
ISBN:
9781337091992
Author:
N. Gregory Mankiw
Publisher:
Cengage Learning
Principles of Microeconomics (MindTap Course List)
Economics
ISBN:
9781305971493
Author:
N. Gregory Mankiw
Publisher:
Cengage Learning
Principles of Economics (MindTap Course List)
Economics
ISBN:
9781305585126
Author:
N. Gregory Mankiw
Publisher:
Cengage Learning

Principles of Microeconomics
Economics
ISBN:
9781305156050
Author:
N. Gregory Mankiw
Publisher:
Cengage Learning

Managerial Economics: Applications, Strategies an…
Economics
ISBN:
9781305506381
Author:
James R. McGuigan, R. Charles Moyer, Frederick H.deB. Harris
Publisher:
Cengage Learning

Principles of Economics 2e
Economics
ISBN:
9781947172364
Author:
Steven A. Greenlaw; David Shapiro
Publisher:
OpenStax