9. Elasticity and total revenue The following graph shows the demand curve for kumquats. Points A, B, C, and D mark price ranges over which you will be asked to calculate the p elasticity of demand for this good. Use the purple rectangle labeled Total Revenue (diamond symbols) to compute total revenue at various prices along the demand curve. To see the area of the Total Revenue rectangle, select the shaded area with your mouse. You will not be graded on where you place the rectangle. 10 Total Revenue B 5 1 2 3 4 QUANTITY (Thousands of bushels) 01 7 10 Calculate the price elasticity of demand between points A and B and points C and D using the midpoint method, and fill in the Price Elasticity of Demand column in the following table. Then for each price range, identify whether demand is elastic, inelastic, or unit elastic. Price Range Price Elasticity of Demand Elastic, Inelastic, Unit Elastic Change in Total Revenue between Points A and B C and D In the previous table, for each price range, indicate whether total revenue increases, decreases, or does not change. PRICE (Dollars per bushel per month)
9. Elasticity and total revenue The following graph shows the demand curve for kumquats. Points A, B, C, and D mark price ranges over which you will be asked to calculate the p elasticity of demand for this good. Use the purple rectangle labeled Total Revenue (diamond symbols) to compute total revenue at various prices along the demand curve. To see the area of the Total Revenue rectangle, select the shaded area with your mouse. You will not be graded on where you place the rectangle. 10 Total Revenue B 5 1 2 3 4 QUANTITY (Thousands of bushels) 01 7 10 Calculate the price elasticity of demand between points A and B and points C and D using the midpoint method, and fill in the Price Elasticity of Demand column in the following table. Then for each price range, identify whether demand is elastic, inelastic, or unit elastic. Price Range Price Elasticity of Demand Elastic, Inelastic, Unit Elastic Change in Total Revenue between Points A and B C and D In the previous table, for each price range, indicate whether total revenue increases, decreases, or does not change. PRICE (Dollars per bushel per month)

Essentials of Economics (MindTap Course List)
8th Edition
ISBN:9781337091992
Author:N. Gregory Mankiw
Publisher:N. Gregory Mankiw
Chapter5: Elastic And Its Application
Section: Chapter Questions
Problem 8PA: The New York Times reported (Feb. 17, 1996) that subway ridership declined after a fare increase:...

Related questions
Question
i need help with this microeconmics question 9
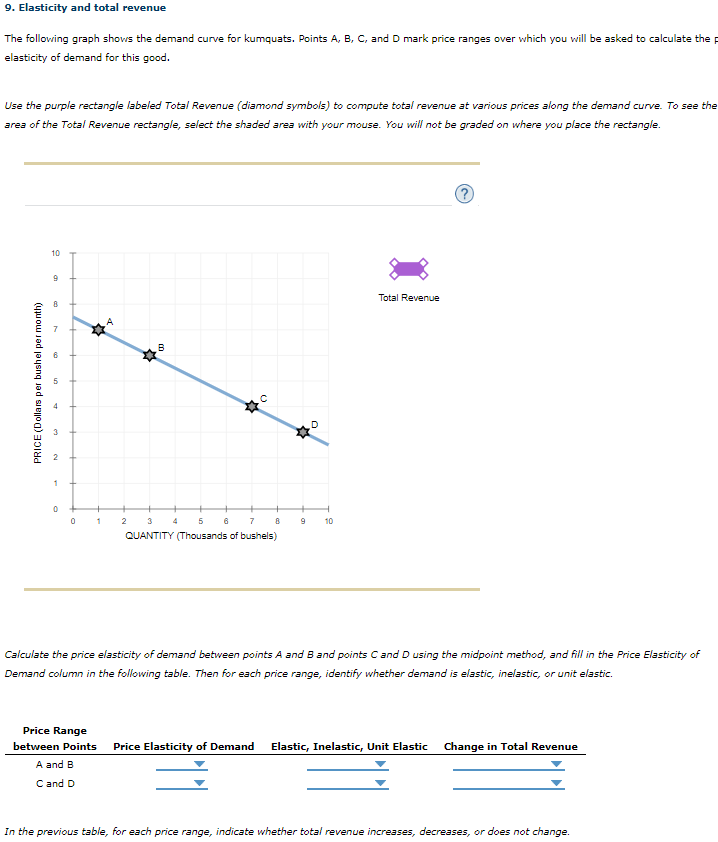
Transcribed Image Text:9. Elasticity and total revenue
The following graph shows the demand curve for kumquats. Points A, B, C, and D mark price ranges over which you will be asked to calculate the p
elasticity of demand for this good.
Use the purple rectangle labeled Total Revenue (diamond symbols) to compute total revenue at various prices along the demand curve. To see the
area of the Total Revenue rectangle, select the shaded area with your mouse. You will not be graded on where you place the rectangle.
10
Total Revenue
B
5
1
2 3 4
QUANTITY (Thousands of bushels)
01
7
10
Calculate the price elasticity of demand between points A and B and points C and D using the midpoint method, and fill in the Price Elasticity of
Demand column in the following table. Then for each price range, identify whether demand is elastic, inelastic, or unit elastic.
Price Range
Price Elasticity of Demand
Elastic, Inelastic, Unit Elastic Change in Total Revenue
between Points
A and B
C and D
In the previous table, for each price range, indicate whether total revenue increases, decreases, or does not change.
PRICE (Dollars per bushel per month)
Expert Solution
This question has been solved!
Explore an expertly crafted, step-by-step solution for a thorough understanding of key concepts.

This is a popular solution!

Trending now
This is a popular solution!

Step by step
Solved in 3 steps with 3 images

Knowledge Booster


Learn more about
Need a deep-dive on the concept behind this application? Look no further. Learn more about this topic, economics and related others by exploring similar questions and additional content below.Recommended textbooks for you
Essentials of Economics (MindTap Course List)
Economics
ISBN:
9781337091992
Author:
N. Gregory Mankiw
Publisher:
Cengage Learning

Managerial Economics: Applications, Strategies an…
Economics
ISBN:
9781305506381
Author:
James R. McGuigan, R. Charles Moyer, Frederick H.deB. Harris
Publisher:
Cengage Learning

Principles of Economics 2e
Economics
ISBN:
9781947172364
Author:
Steven A. Greenlaw; David Shapiro
Publisher:
OpenStax
Essentials of Economics (MindTap Course List)
Economics
ISBN:
9781337091992
Author:
N. Gregory Mankiw
Publisher:
Cengage Learning
Managerial Economics: Applications, Strategies an…
Economics
ISBN:
9781305506381
Author:
James R. McGuigan, R. Charles Moyer, Frederick H.deB. Harris
Publisher:
Cengage Learning
Principles of Economics 2e
Economics
ISBN:
9781947172364
Author:
Steven A. Greenlaw; David Shapiro
Publisher:
OpenStax


