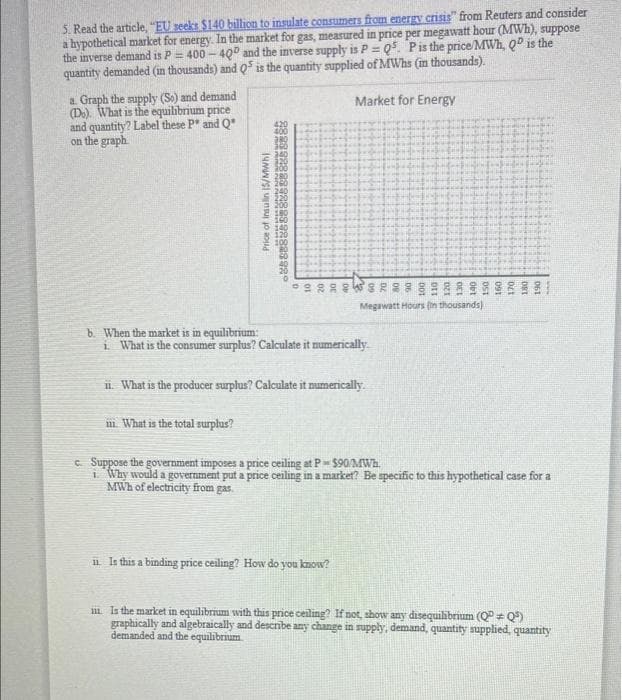
5. Read the article, "EU seeks $140 billion to insulate consumers from energy crisis" from Reuters and consider a hypothetical market for energy. In the market for gas, measured in price per megawatt hour (MWh), suppose the inverse demand is P = 400-40° and the inverse supply is P=Q5. P is the price/MWh, Q is the quantity demanded (in thousands) and Q5 is the quantity supplied of MWhs (in thousands). a. Graph the supply (So) and demand (De). What is the equilibrium price and quantity? Label these P and Q on the graph Price of insulin 15/MWh 38928928892889 42° Market for Energy 2288 228 221 Megawatt Hours (in thousands) b. When the market is in equilibrium: i. What is the consumer surplus? Calculate it numerically. ii. What is the producer surplus? Calculate it numerically. in. What is the total surplus? c. Suppose the government imposes a price ceiling at P-$90/MWh. 1. Why would a government put a price ceiling in a market? Be specific to this hypothetical case for a MWh of electricity from gas. i Is this a binding price ceiling? How do you know? Is the market in equilibrium with this price ceiling? If not, show any disequilibrium (QPQ) graphically and algebraically and describe any change in supply, demand, quantity supplied, quantity demanded and the equilibrium
5. Read the article, "EU seeks $140 billion to insulate consumers from energy crisis" from Reuters and consider a hypothetical market for energy. In the market for gas, measured in price per megawatt hour (MWh), suppose the inverse demand is P = 400-40° and the inverse supply is P=Q5. P is the price/MWh, Q is the quantity demanded (in thousands) and Q5 is the quantity supplied of MWhs (in thousands). a. Graph the supply (So) and demand (De). What is the equilibrium price and quantity? Label these P and Q on the graph Price of insulin 15/MWh 38928928892889 42° Market for Energy 2288 228 221 Megawatt Hours (in thousands) b. When the market is in equilibrium: i. What is the consumer surplus? Calculate it numerically. ii. What is the producer surplus? Calculate it numerically. in. What is the total surplus? c. Suppose the government imposes a price ceiling at P-$90/MWh. 1. Why would a government put a price ceiling in a market? Be specific to this hypothetical case for a MWh of electricity from gas. i Is this a binding price ceiling? How do you know? Is the market in equilibrium with this price ceiling? If not, show any disequilibrium (QPQ) graphically and algebraically and describe any change in supply, demand, quantity supplied, quantity demanded and the equilibrium

Principles of Economics 2e
2nd Edition
ISBN:9781947172364
Author:Steven A. Greenlaw; David Shapiro
Publisher:Steven A. Greenlaw; David Shapiro
Chapter4: Labor And Financial Markets
Section: Chapter Questions
Problem 31P: Table 4.6 shows the amount of savings and barrowing in a market for loans lo purchase homes,...

Related questions
Question
6
Transcribed Image Text:5. Read the article, "EU seeks $140 billion to insulate consumers from energy crisis" from Reuters and consider
a hypothetical market for energy. In the market for gas, measured in price per megawatt hour (MWh), suppose
the inverse demand is P = 400-40° and the inverse supply is P=Q5. P is the price/MWh, Q is the
quantity demanded (in thousands) and Q5 is the quantity supplied of MWhs (in thousands).
a. Graph the supply (So) and demand
(Do). What is the equilibrium price
and quantity? Label these P and Q
on the graph
b. When the market is in equilibrium:
Price of Insulin 15/MWh)
28 28 928 98 988 23 32 823 22°
What is the total surplus?
Market for Energy
i. What is the consumer surplus? Calculate it numerically
Megawatt Hours (in thousands)
ii. What is the producer surplus? Calculate it numerically.
11. Is this a binding price ceiling? How do you know?
c. Suppose the government imposes a price ceiling at P-$90/MWh.
1. Why would a government put a price ceiling in a market? Be specific to this hypothetical case for a
MWh of electricity from gas.
Is the market in equilibrium with this price ceiling? If not, show any disequilibrium (Q+Q³)
graphically and algebraically and describe any change in supply, demand, quantity supplied, quantity
demanded and the equilibrium
Expert Solution
This question has been solved!
Explore an expertly crafted, step-by-step solution for a thorough understanding of key concepts.

Step by step
Solved in 3 steps with 2 images

Knowledge Booster


Learn more about
Need a deep-dive on the concept behind this application? Look no further. Learn more about this topic, economics and related others by exploring similar questions and additional content below.Recommended textbooks for you
Principles of Economics 2e
Economics
ISBN:
9781947172364
Author:
Steven A. Greenlaw; David Shapiro
Publisher:
OpenStax

Principles of Microeconomics (MindTap Course List)
Economics
ISBN:
9781305971493
Author:
N. Gregory Mankiw
Publisher:
Cengage Learning

Principles of Macroeconomics (MindTap Course List)
Economics
ISBN:
9781285165912
Author:
N. Gregory Mankiw
Publisher:
Cengage Learning
Principles of Economics 2e
Economics
ISBN:
9781947172364
Author:
Steven A. Greenlaw; David Shapiro
Publisher:
OpenStax
Principles of Microeconomics (MindTap Course List)
Economics
ISBN:
9781305971493
Author:
N. Gregory Mankiw
Publisher:
Cengage Learning
Principles of Macroeconomics (MindTap Course List)
Economics
ISBN:
9781285165912
Author:
N. Gregory Mankiw
Publisher:
Cengage Learning

Essentials of Economics (MindTap Course List)
Economics
ISBN:
9781337091992
Author:
N. Gregory Mankiw
Publisher:
Cengage Learning

Principles of Macroeconomics (MindTap Course List)
Economics
ISBN:
9781305971509
Author:
N. Gregory Mankiw
Publisher:
Cengage Learning

Principles of Microeconomics
Economics
ISBN:
9781305156050
Author:
N. Gregory Mankiw
Publisher:
Cengage Learning