
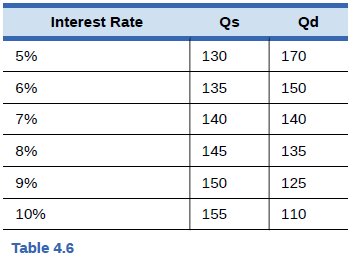
Table 4.6 shows the amount of savings and barrowing in a market for loans lo purchase homes, measured in millions of dollars, at various interest rates. What is the equilibrium interest rate and quantity in the capital financial market? How can you tell? Now, imagine that because of a shift in the perceptions of foreign investors, the supply curve shifts so that there will be

Trending nowThis is a popular solution!

Chapter 4 Solutions
Principles of Economics 2e
Additional Business Textbook Solutions
Principles of Accounting Volume 1
Construction Accounting And Financial Management (4th Edition)
Managerial Accounting (4th Edition)
Principles of Accounting Volume 2
Horngren's Accounting (12th Edition)
Horngren's Cost Accounting: A Managerial Emphasis (16th Edition)

- Imagine that you are in the position of buying loans in the secondary market (that is, buying the right to collect the payments on loans) for a bank or other financial services company. Explain why you would be willing to pay more or less for a given loan If: The borrower has been late on a number of loan payments Interest rates In the economy as a whole have risen since the bank made the loan The borrower Is a firm that has just declared a high level of profits Interest rates in the economy as a whole have fallen since the bank made the loanarrow_forwardThe diagram below show the market for financial capital assuming that national income is constant at Y*. Suppose national saving is reflected by NS and investment demand is reflected by 10. If the real interest rate is i3, there is which will drive the interest rate up until it reaches i * A. an excess supply of national saving O B. an excess demand for private saving C. an excess demand for financial capital D. an excess supply of financial capital O E. an excess demand for investment O F. an excess supply of public saving Real Interest Rate i ₂ Bug NS0 Quantity of financial capital ($) NS1 18arrow_forwardThe interest rate commonly used by banks to borrow from each other outside the US, which is also used for revolving loans inside the US, is the O REPO O IEURO O LOREN O LIBORarrow_forward
- Q17arrow_forwardSuppose the Bank of Canada lowers its target for the overnight interest rate and longer-term interest rates in the market fall as a result. When this occurs, the commercial banks respond to in the demand for loans by... O a. An increase; selling government securities to the Bank of Canada in exchange for cash, with which they can extend new loans. O b. A decrease; buying government securities from the Bank of Canada in exchange for cash, and calling in existing loans. An increase; buying government securities from the Bank of Canada, against which they can extend new loans. O d. A decrease; selling government securities to the Bank of Canada and calling in existing loans. Oe. An increase; borrowing cash from the Bank of Canada with which they can extend new loans.arrow_forward4arrow_forward
- If interest rates in the economy rise over time this is: O Good for lenders but bad for borrowers O Good for borrowers but bad for lenders O Good for lenders and borrowers Bad for lenders and borrowersarrow_forward20. Hyundai was manufacturing cars in South Korea that were exported to the United States, but now has a car manufacturing plant in the United States. Assuming that Hyundai's sales in the Uníted States remain the same, and the cars from their new U.S. plant are all sold in the United States, then producing more Hyundais in the United States would: decrease imports to the United 5tates. O increase U.5. exports, decrease U.5. exports. O increase imports to the United 5tates.arrow_forwardHow do an increase in the exchange rate and an increase in expected future income change aggregate demand? Aggregate demand when an increase in the exchange rate occurs. Aggregate demand when an increase in expected future income occurs. O A. increases; increases O B. increases; decreases O C. decreases; increases O D. decreases; decreases The graph shows an aggregate demand curve. Suppose there is an increase in the exchange rate. Draw a new curve to show the effect of this change on aggregate demand. Label the new curve C₁. Now suppose that there is an increase in expected future income. Draw a new curve to show the effect of this change on the original AD curve. Label the new curve C₂- 140- 130- 120- 110- 100- 90- 80+ Price level (GDP deflator, 2007=100) 1.6 AD 1.7 1.8 1.9 Real GDP (trillions of 2007 dollars) 2.0 Q ✔arrow_forward
- In the Graph, what is the equilibrium level of real GDP and equilibrium price? S 120 110 100 S 5,000 6,000 7,500 Real GDP (billions of dollars per year) $5,000 billion real GDP and price level of 120 $5,000 billion real GDP and price level of 110 $6,000 billion real GDP and price level of 110 $7,500 billion real GDP and price level of 100 O O O O Price Levelarrow_forward12arrow_forwardRent / Unit m lo O Equilibrium occupancy O Market rent O Vacancy O Shortage O Interest rate D Supply Demand Existing Stock of Space Consider the figure above. Point E represents: Units of Spacearrow_forward
 Principles of Economics 2eEconomicsISBN:9781947172364Author:Steven A. Greenlaw; David ShapiroPublisher:OpenStax
 Essentials of Economics (MindTap Course List)EconomicsISBN:9781337091992Author:N. Gregory MankiwPublisher:Cengage Learning
 Brief Principles of Macroeconomics (MindTap Cours...EconomicsISBN:9781337091985Author:N. Gregory MankiwPublisher:Cengage Learning