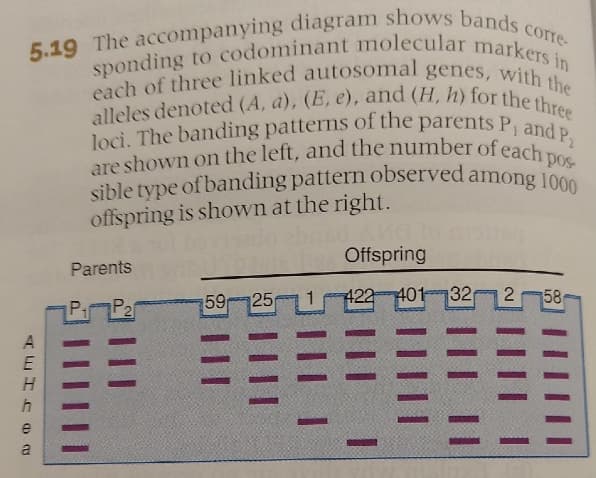
5.19 The accompanying diagram shows bands corre- sponding to codominant molecular markers in each of three linked autosomal genes, with the alleles denoted (A, a), (E, e), and (H, h) for the three loci. The banding patterns of the parents P and P are shown on the left, and the number of each pos- sible type of banding pattern observed among 100C offspring is shown at the right. Offspring Parents 59 25 422 40132 58 P1 e a

Human Heredity: Principles and Issues (MindTap Course List)
11th Edition
ISBN:9781305251052
Author:Michael Cummings
Publisher:Michael Cummings
Chapter4: Pedigree Analysis In Human Genetics
Section: Chapter Questions
Problem 8QP: Analysis of Autosomal Recessive and Dominant Traits In the following pedigree, assume that the...
icon
Related questions
Question

Question: This is a normal 3 point test cross, except that instead of regular phenotypes, you are looking at DNA markers on a gel. One parent, according to the gel, is heterozygous at each marker. The other parent is homozygous for each marker. (Again, this means it is a test cross: AaEeHh x AAEEHH --but don't be confused by that, because these are not "dominant" and "recessive" per se; the phenotype is just a band on a gel). For each offspring, figure out its genotype (homozygous or heterozygous for each gene. Then, figure that one parent made only AEH gametes, so you can cross that out if it helps.) Then treat it pretty much the same as a 3 point test cross.

5.19 The accompanying diagram shows bands corre-
alleles denoted (A, a), (E, e), and (H, h) for the three
sible type of banding pattern observed among 1000
are shown on the left, and the number of each pos-
loci. The banding patterns of the parents P and P
each of three linked autosomal genes, with the
sponding to codominant molecular markers in
offspring is shown at the right.
Offspring
Parents
59 25
422
401 32 2
58
Pi P21
A
e
a
Transcribed Image Text:5.19 The accompanying diagram shows bands corre- alleles denoted (A, a), (E, e), and (H, h) for the three sible type of banding pattern observed among 1000 are shown on the left, and the number of each pos- loci. The banding patterns of the parents P and P each of three linked autosomal genes, with the sponding to codominant molecular markers in offspring is shown at the right. Offspring Parents 59 25 422 401 32 2 58 Pi P21 A e a
Expert Solution
trending now

Trending now

This is a popular solution!

steps

Step by step

Solved in 4 steps with 1 images

Blurred answer
Knowledge Booster
Communication
Learn more about
Need a deep-dive on the concept behind this application? Look no further. Learn more about this topic, biology and related others by exploring similar questions and additional content below.
Similar questions
  • SEE MORE QUESTIONS
Recommended textbooks for you
Human Heredity: Principles and Issues (MindTap Co…
Biology
ISBN:
9781305251052
Author:
Michael Cummings
Publisher:
Cengage Learning
Biology 2e
Biology 2e
Biology
ISBN:
9781947172517
Author:
Matthew Douglas, Jung Choi, Mary Ann Clark
Publisher:
OpenStax
Curren'S Math For Meds: Dosages & Sol
Nursing
ISBN:
9781305143531
Author:
CURREN
Publisher:
Cengage