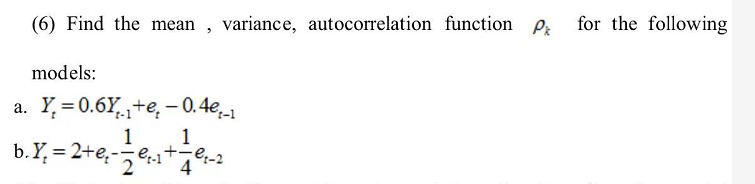
(6) Find the mean , variance, autocorrelation function P for the following models: a. Y= 0.6Y+e, - 0.4e-1 1 b. Y, = 2+e,-e.+e-2 %3D


Q: Is there a significant linear correlation between the following variables (x and y)? Subject ID 1…
A: Here, x y x-x y-y (x-x)(y-y) (x-x)2 (y-y)2 10 20 -10.1429 -21.1429 214.4503 102.8784 447.0222…
Q: The following data are measurements of temperature (x = °F) and chirping frequency (y = chirps per…
A: In the given information the data of measurement of temperature and chirping frequency for the…
Q: A set of n=15 pairs of scores (X and Y values) has SSx= 4, SSy=25, and SP=6. What is the Pearson…
A: Given sample size n = 15SSx = 4, SSy = 25 and Sp = 6.The pearson correlation coefficient is…
Q: The following table gives the distribtution of weekly income of 160 families in a town : Weekly…
A: Given : n = 160
Q: The weights (in pounds) of 6 vehicles and the variability of their braking distances (in feet) when…
A: The answer and calculation given below
Q: (a) (b) (c) (d) (e) (f) (8) Match the above graphs with the corresponding linear correlation…
A: Given Information:
Q: Suppose that X and Y are unknown with E(X) = 10, Var(X) = 4, E(Y) = 12 and Var (Y) = 100. In…
A: Solution: From the given information,
Q: Q3/A/ Let X be a r.v with p.d.f f(x) =e-xl - 00 <x < oo, then the value of variance of X is -
A: Given :Let X be a r.v with p.d.f f(x)=12e-|x|Formula : ∫-∞∞f(x)dx
Q: The following estimator for the population variance (x; – x)² п i=1
A: An estimator is said to be consistent if, as the sample size increases, the sampling distribution of…
Q: X 1 2 Y O 0.70 0.00 1 0.00 0.30 a) Compute and interpret the covariance and correlation between the…
A:
Q: in) Find the auto correlation function and its PSD. ) Find the Mean and Variance of Y (t)
A: Answer: For the given data
Q: Run a regression analysis on the following bivariate set of data with y as the response variable. x…
A: Solution Given data is x y 42.1 45.1 47.5 -9 31.6 39.8 41.5 16.3 19.5 87.4 37.2 31.7 47.1 19.7 66.6…
Q: Q3/A/ Let X be a r.v with p.d.f f(x) =;e-lkl - 00 <x < 0, then the value of variance of X is
A: 3. Given information: It was stated that X is a random variable and the probability density function…
Q: Find the correlation coefficient for each of the two data sets shown below. (a) (c)
A: Given: (a) x y 1 5 1 3 1 5 1 7 2 3 2 3 2 1 3 1 3 1 4 1 (c) x y 1 2…
Q: 70 vi=1 Xi 1406, Σο1x. = 29042 i=D1
A: From the provided information,
Q: 2. The following data represent the observed number of defective disks produced each hour based on…
A: Since you have posted a question with multiple sub-parts, we will solve first three sub-parts for…
Q: Here is a bivariate data set. X y 47.1 59.5 47.4 64.8 68.8 7.7 56.3 39.3 45.7 41.5 45.2 58 57.5 40.5…
A: A bivariate data set is given.
Q: Y g e ra 38. If covariance between X and Y variables is 10 and the variances of X and Y are…
A:
Q: Assume that variables xx and yy have a significant correlation, and that the line of best fit has…
A: Given , The variables x and y have a significant correlation. The line of best fit is, ( Use…
Q: Here is a bivariate data set. y 27 40 24 42 23 45 19 41 25 42 27 40 26 39 Find the correlation…
A:
Q: The weights (in pounds) of 6 vehicles and the variability of their braking distances (in feet) when…
A: Given that
Q: Here is a bivariate data set. X 18.5 32.1 32.7 62.1 15.6 62.4 32.7 51 26.6 113.1 Find the…
A:
Q: b) the correlation coefficient :of this data is
A: here use basic of Correlation coefficient
Q: What is a control variable, and how does it differ from a variable of interest?Looking at Table,…
A: Introduction: A control variable is a variable that has the potential to affect the response…
Q: Find out the regression coeticients of Y on X and X on Y from the following data: ΣΧ= 50 , X= 5, Σ Υ…
A:
Q: or the following set of scores: X Y 0 16 1 6 2 9 3 0 4 9 (a) Compute the Pearson…
A: From given data, X Y X*Y X*X Y*Y 0 16 0 0 256 1 6 6 1 36 2 9 18 4 81 3 0 0 9 0 4 9 36…
Q: What is the value of the linear correlation coefficient "r" for the fol y 2 4 1.
A: The formula for the relation correlation coefficient is given as follows r=∑xi-x∑yi-y∑xi-x2∑yi-y2
Q: You are interested in the relationship between watching reality T.V. and headaches. Consider the…
A: Given data represents hours spent watching reality T.V. (X) and average number of headaches (Y).…
Q: The following data were obtained for a sample of 10 men from a height and Σ (x₁ - x)² = 120, Ey? =…
A:
Q: The weights (in pounds) of 6 vehicles and the variability of their braking distances (in feet) when…
A: Correlation coefficient : Correlation coefficient is used to measures strength of the association…
Q: 3. If e is a point estimator of the parameter 0, with E(@) = 0, then e is a(an) ( A. biased…
A: # Point estimator of theta is thera^ such that E(theta^)=theta which means theta^ is called ??
Q: Calculate co-efficient of correlation from the following information by taking deviation from actual…
A: Correlation is the degree or extent of relationship between two variables.
Q: In a sample analysis with 50 respondents, we wanted to study the relationship between the number X…
A:
Q: A major credit card company is interested in whether there is a linear relationship between its…
A: Explanation: When we perform hypothesis test in statistics The claim shall be in the alternative…
Q: . (a) Calculate correlation and regression coefficient from the following data: 14 2 6 8 10 12 4 2 5…
A:
Q: Match the calculated correlations to the corresponding scatterplot. (1) (2) (3) (4) DI
A: Solution
Q: Consider an estimator of μ: W= 1/6 Y1+1/16Y2+1/4Y3+1/8Y4+1/2Y5 This is an example of a weighted…
A: Estimation and Estimator: When we are concerned in finding numerical values of unknown parameter(s),…
Q: Percent of school children receiving free or reduced-fee lunches at school (X, P_RFM) and percent of…
A: “Since you have posted a question with multiple sub-parts, we will solve first three sub- parts for…
Q: For the Venn diagram below, what would best describe the variance explained by x1 in a multiple…
A:
Q: A set of n=4 pairs of X and Y value has SSx=6, SSy=18, and SP=9, for these data, what is the pearson…
A: Given information- No. of pairs, n = 4 Sum of square of x (SSx) = 6 Sum of square of y (SSy) = 18…
Q: . The following data represent the observed number of defective disks produced each hour based on…
A: Since you have posted a question with multiple sub-parts, we will solve first three sub-parts for…
Q: Consider the following data points, where the first coordinate corresponds to x and the second…
A: From the given information, Variance of b1 is 0.25 The t statistic associated to b1 is equal to…
Q: Consider the following correlations -0.9 , -0.5 , -0.2 , 0 , 0.2 , 0.5 and 0.9. For each give the…
A: Given, the correlations -0.9 , -0.5 , -0.2 , 0 , 0.2 , 0.5 and 0.9. We need to calculate the…
Q: For the following scores, X Y 1 7 4 2 1 3 1 6 2 0 0 6 2 3 1 5 a. Sketch a scatter plot and estimate…
A: a) Scatter plot for given data points: Step-by-step software procedure to draw scatter plot using…
Q: Solve the following problems completely. An article in the Journal of Environmental Engineering…
A: The data set shows the data x and y variables.
Q: Calculate the co-efficient of correlation and the lines of regression for the following data: 1 2 3…
A:
Q: Here is a bivariate data set. x -10.8 35.2 38.8 30.9 37.5 35.3 y 87.2 65.4 138.4 54 17.7 29.4 Find…
A:
Q: Here is a bivariate data set. x y 34.3 47 31.3 47.9 39.1 77.9 37.3 23.3 25.5 -39.3 28.8 53.4 38…
A: Correlation coefficient - r: The Karl Pearson’s product-moment correlation coefficient or simply,…

Step by step
Solved in 3 steps
