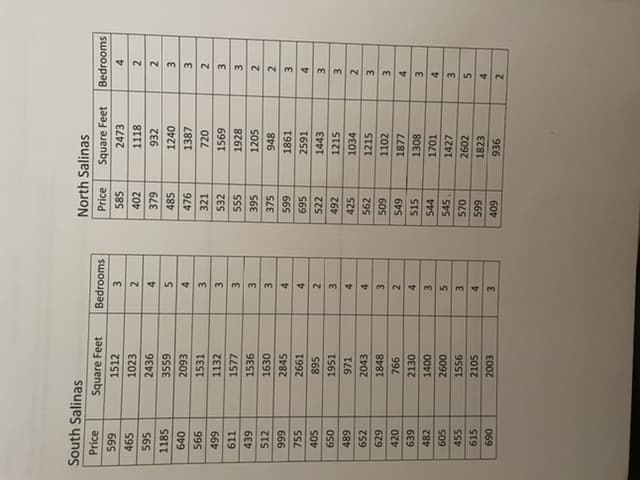
6) Test for a linear correlation between price and bedrooms in North Salinas.


Q: For the following values of SSX, SSY, and SP, the Pearson correlation coefficient (r) is ______ and…
A: Given,ssx=100 ssy=200sp=90
Q: Despite Progress - Millions Without Access to Education Number of out-of-school children worldwide…
A: Statistics are has two branches, they are descriptive and inferential statistic. Descriptive…
Q: Directions. Test the significance of the following correlation coefficients. 3. -0.58 4. 0.63 5.…
A: To test the significance of the correlation, we state hypothesis. H0: There is no significant…
Q: From the scatter plot, which of the following is TRUE? Scatterplot of Apartment Price vs Distance…
A:
Q: The time required to assemble an electronic component is normally distributed with a mean and a…
A:
Q: Over the past 5 years, U.S. airlines average about 1 fatality per month (U.S. Department of…
A: Given: Meanμ=1 Consider, X be the random variable that follows the Poisson distribution with the…
Q: Computer output for fitting a simple linear model is given below. State the value of the sample…
A:
Q: can you please explain the details for the equation Pn = P0 (1+R)n
A:
Q: If the sum of squares error (SSE) is 375, hence which of the following is FALSE? O a. Sum of squares…
A: It is given that the sum of squares error (SSE) is 375.
Q: Directions. Test the significance of the following correlation coefficients. 1. 0.62 2.-0.77 3.…
A: As per our guidelines I can solve only first 3 subparts. Post the remaining subparts again and…
Q: Bones Brothers & Associates prepare individual tax returns. Over prior years, Bones Brothers has…
A: Given data Mean=90 SD=14 n=130 P(88<X<92)=P(88-90/14/√130<X<92- 90/14/√130)…
Q: From the scatter plot, which of the following is FALSE? Bicarbonate (parts per million) 250 200 150…
A: We know that regression Hypothesis H0: β1 = 0 HA: β1 ≠ 0 That means the larger the distance…
Q: A survey found that women’s heights are normally distributed with mean 63.8 in and a standard…
A: GivenMean(μ)=63.8standard deviation(σ)=2.2a branch of the military requires women's heights to be…
Q: Suppose that f(x,y)= [15x²y ; 0<x<y<1 0; otherwise.
A:
Q: Suppose that one in six smartphone users have fallen prey to cyber-attack. We use a sample of 200…
A:
Q: III. Two of the five (5) foreign automobiles from an overseas shipment have slight paint blemishes.…
A: Given that Two of the five (5) foreign automobiles from an overseas shipment have slight paint…
Q: For many years businesses have struggled with the rising cost of health care. But recently, the…
A: Givensample proportion(p^)=0.60sample size(n)=979Confidence level=95%
Q: sold and the geographic region of the sale; and the third number is the following value. (fo-fe)²…
A: From the above data
Q: The time it takes for Mellow Mushroom to cook a pizza is normally distributed with a mean of 20…
A:
Q: A mail order company has an 8% success rate. If it mails advertisements to 502 people, find…
A: Given that Success of probability p=8%=0.08 Sample size n =502
Q: A study was done on proctored and nonproctored tests. The results are shown in the table. Assume…
A: From the given information we have For Proctored Sample size (n1) = 32 Sample mean (x̅1) = 78.75…
Q: QUESTION 26 A researcher believes taking fish oil will reduce inflammation in older adults with…
A: Critical Value: To consider whether to rejection of the null hypothesis in statistical tests, a…
Q: Three people get into an empty elevator at the first floor of a building that has 7 floors. Each…
A:
Q: For many years businesses have struggled with the rising cost of health care. But recently, the…
A:
Q: A sample mean, sample standard deviation, and sample size are given. Use the one-mean t-test to…
A: Given: Sample mean x¯= 3.13 s = 0.59 n = 9 α =…
Q: The smaller the distance between observed data points and the regression line, the smaller the sum…
A: Smaller SSR indicate better model. SSR used for measuring or determine the dispersion of data…
Q: Which of the following represents Type II error? a. Rejecting the Ho after a test statistic results…
A: Given that We need to find the Condition which represents the Type II error. We know that When…
Q: he probability of winning 5 games in 11 attempts is 0.4831. The number of games won has a binomial…
A: Given: The probability of winning 5 games in 11 attempts is 0.4831 The number of games won has a…
Q: 2) Test the claim that the Precalculus class has an average that is over 70.
A: 2. Denote μ as the true average for the Precalculus class.
Q: Using the Food and Travel Spending.xlsx data, what is the average spending on travel for people who…
A: Given: Total number of observations = 493 Number of people who own car = 160 Formula Used: In MS…
Q: Human skin loses water through evaporation, and, in general, damaged skin loses water at a faster…
A: The confidence level is 0.95.
Q: The slope for an independent variable X predicts where the regression line crosses the Y (dependent)…
A: Given: The slope for an independent variable X predicts where the regression line crosses the Y…
Q: K @ 2 Which of the following would be a correct interpretation of a 99% confidence interval such as…
A:
Q: 6. The following sample contains the scores of 6 students selected at random in Mathematics and…
A: S
Q: In a small town in Colorado, it was found that 54% of the population support Candidate Randy. In a…
A: For the given data Perform z test for one proportion
Q: QUESTION 29 I am trying to visualize my continuous data in graph form. I should use a/an: O…
A: The objective is to identify the graph for continuous data.
Q: 2) A researcher is interested in studying if male smokers and female smokers smoke a different…
A: The test statistic in a research study is examined in this section information that is being used to…
Q: The length of fish were measured at 3 different lakes. Lake 1: 3.5, 4.2, 6.1, 5.2 Lake 2: 5.1,…
A: The given data is: Lake 1 Lake 2 Lake 3 3.5 5.1 5.6 4.2 6.2 7.1 6.1 5.3 2.4 5.2 2.1 4.1…
Q: The BLS uses sampling for its National Compensation Survey to report employment costs. In its second…
A:
Q: Assume that a randomly selected subject is given a bone density test. those test scores are normally…
A: Let X be the random variable from standard normal distribution with mean (μ) = 0 standard deviation…
Q: Maple syrup is a non-negligible nutritional source of manganese. It is made from the sap of two…
A: i) The point estimate for μ1-μ2 is, Point Estimate=X¯1-X¯2=3.29-2.55=-0.26
Q: The Office of Student Services at a large western state university maintains information on the…
A: Followings are the Explanation of the question
Q: 5. Suppose that the age of a randomly selected business major can be considered to be a random…
A: We have given the following information Mean = 20 Standard deviation = 2 And n = 64
Q: A sample mean, sample standard deviation, and sample size are given. Use the one-mean t-test to…
A: Sample mean x¯ = 43.9 s = 5.3 n = 15 α = 0.05
Q: So what are the critical value(s) is/are (If there are two critical values separate each with a…
A: The test is left tailed test.
Q: I need the p value, please.
A: Hypothesis test are used to determine using two methods. They are p value approach and critical…
Q: The population mean and standard deviation are given below. Find the required probability and…
A: Given data: Sample size, n = 63 Population mean, μ=22 Population standard deviation, σ=1.29 Required…
Q: Two variables are defined, a regression equation is given, and one data point is given. Study =…
A: Given Y-cap= 41.1+3.6(Study) The data point is a student who studied 10 hours and received an 81 on…
Q: iz K 30: F2 Za/2= (Round to two decimal places as needed.) Find the critical value Za/2 that…
A:
Q: 4. Failure to meet payments on student loans guaranteed by the United States (U.S.) government has…
A:
***ONLY QUESTION 6***
House prices are $1,000 each

Step by step
Solved in 2 steps

- A Bitter Dispute With the publication of Ars Magna, a dispute intensified between Jerome Cardan and another mathematician named Niceolo Fontana, otherwise known as Tartaglia. What was the dispute, and how did it arise? In your opinion, who was at fault? Write a paragraph or two about your findings.Sale Price 12400 10400 12100 10000 11000 8895 7675 9975 6350 10470 9895 11250 8795 12500 9340 10150 9200 9395 11000 10640 10000 7500 8000 10440 10200 10300 9740 9280 10930 8000 9000 7680 9400 10730 7350 12240 11970 8240 9910 10080 9440 8970 9500 10050 10130 11400 8500 7500 9090 10500 According to the National Automobile Dealers Association, the mean price for used cars is $10,192. A manager of a Kansas City used car dealership reviewed a sample of 50 recent used car sales at the dealership in an attempt to determine whether the population mean price for used cars at this particular dealership differed from the national mean. The prices for the sample of 50 cars are shown in the file named UsedCars. Formulate the hypotheses that can be used to determine whether a difference exists in the mean price for used cars at the dealership. What is the p-value? At , what is your conclusion?775 1065 896 930 1052 846 949 797 1041 962 1028 910 1067 982 879 1097 1071 1056 1021 928 1045 974 1112 975 887 1069 1040 927 867 864 983 987 906 1030 934 662 1004 901 1123 1033 1028 934 1148 1027 978 1139 1078 1088 948 912 942 860 822 911 938 1000 944 980 915 899 852 989 978 991 996 878 833 865 1069 779 960 907 1009 1118 903 957 1014 885 947 1006 1036 824 866 860 986 972 916 991 851 1050 980 983 977 864 903 940 995 842 1122 1036 The table above represents the average rent for 100 randomly selected U.S. cities. According to www.apartments.com, the average rent for a two-bedroom apartment in the city of Napa is $1,967. How do other U.S. cities’ rents compare to Napa? Are they about the same, on average, or are rents significantly lower elsewhere? 1) To test this hypothesis, two…
- 775 1065 896 930 1052 846 949 797 1041 962 1028 910 1067 982 879 1097 1071 1056 1021 928 1045 974 1112 975 887 1069 1040 927 867 864 983 987 906 1030 934 662 1004 901 1123 1033 1028 934 1148 1027 978 1139 1078 1088 948 912 942 860 822 911 938 1000 944 980 915 899 852 989 978 991 996 878 833 865 1069 779 960 907 1009 1118 903 957 1014 885 947 1006 1036 824 866 860 986 972 916 991 851 1050 980 983 977 864 903 940 995 842 1122 1036 The above table represents the average rent for 100 randomly selected U.S. cities. According to www.apartments.com, the average rent for a two-bedroom apartment in the city of Napa is $1,967. How do other U.S. cities’ rents compare to Napa? Are they about the same, on average, or are rents significantly lower elsewhere? 1) Set up the hypotheses (null and…Sale Price 9950 6536 11554 10049 11542 9339 11022 9858 6863 10912 12028 7661 10783 8959 6602 10123 10234 7104 8970 8490 9682 8208 9496 8352 12003 12260 12824 9733 10592 12232 13010 11725 6700 13104 11166 12684 12293 8152 7110 11255 8361 11550 9871 6634 11298 7594 6258 9413 10991 9304ZIP Code Population Season Pass Holders 45220 14171 224 45219 17576 42 45225 13437 15 45217 5731 78 45214 9952 19 45232 6913 28 45223 13349 83 45229 15713 75 45206 11353 69 45202 15105 83 45203 3411 9 45207 8233 8 41074 5566 36 41073 6193 63 45224 21043 207 41071 21596 133 45205 21683 102 45204 6642 36 41016 5603 42 45216 9028 55 45212 22356 207 41011 25849 193 41014 7913 41 45237 21137 86 45208 18236 424 45211 33968 342 45239 26485 269 41075 15868 236 45209 8941 111 45226 5029 84 45238 42737 564 45231 39939 361 45213 11683 153 45215 28915 308 45218 3917 54 41017 40218 493 41076 14779 176 45251 22887 205 45227 18431 215 45247 20372 357 41015 22298 189 45248 22880 380 45236 21823 310 45240 27033 142 45246 13522 100 45230 25763 423 45233 14175 244 45252 4799 58 41018 29001 244 45243 14755 303 45241 25623 299 45014 44178 307 45242 20015 377 45244 26316 448 41059 2266 22 41048…
- 7065 6870 6858 6641 6306 6671 6663 6492 6569 6601 6653 6729 7237 6911 6784 7312 7313 7082 7462 7311 6994 7399 7231 7666 7574 7706 7561 7198 7255 7116 7362 7511 7773 7776 7547 7567 7679 7627 7883 7274 7072 7165 7025 7125 7195 7318 7461 7624 7717 7450 7108 7053 6768 6896 7158 7152 7171 6902 6968 6619 6427 6567 6422 6686 6976 7069 7222 7381 7495 7460 7721 7804 7558 7781 7517 7795 7976 8038 8122 7854 7924 7754 7824 7935 8233 8304 8094 7974 7659 7538 7282 7435 7399 7712 8259 7935 8142 7696 7366 7182 7184 7408 7408 7805 7187 7074 7141 7245 7518 7748 7620 7434 7489 7345 7557 7490 7625 7691 7698 8019 8015 8064 8068 7839 7923 7939 8215 8730 8487 8444 8364 7893 8183 8226 7987 8287 8400 8424 8545 8250 8371 8420 8567…NORTH–SOUTH AIRLINE CASENorthern Airline DataAirframe CostEngine CostAverage AgeYearper Aircraftper Aircraft(Hours)200151.8043.496,512200254.9238.588,404200369.7051.4811,077200468.9058.7211,717200563.7245.4713,2752006 84.7350.2615,215200778.7479.6018,390Southeast Airline DataAirframe CostEngine CostAverage AgeYearPer Aircraftper Aircraft(Hours)200113.2918.865,107200225.1531.558,145200332.1840.437,360200431.7822.105,773200525.3419.697,150200632.7832.589,364200735.5638.078,2591. Develop Regression equations for each cost category as dependent variables and average age as independent variables. Do this for each Airline. Look at graphs produced by QM2. From the regression results, what would you conclude about a) airframe vs engine costs for each airlineb) comparing airlines as to airframe costsc) comparing airlines as to engine costsd) Provide a brief summary report of your comparisonsPART E PLEASE claims age 3367 50 1094 38 766 34 1725 43 2837 48 2844 48 3692 51 594 31 3049 49 3041 49 3078 49 1897 44 5272 55 1587 42 2804 48 1254 40 1170 39 2312 46 4517 53 596 31 4838 54 2784 48 534 30 1167 39 1862 44 2811 48 768 34 1084 38 3674 51 783 34 917 36 653 32 4861 54 3358 50 1420 41 2569 47 3327 50 2052 45 2318 46 1097 38 840 35 834 35 541 30 1737 43 4111 52 1745 43 3319 50 3683 51 5285 55 2818 48 1857 44 592 31 3709 51 2028 45 4538 53 5322 55 1404 41 1192 39 647 32 3335 50 3304 50 533 30 543 30 842 35 1884 44 5298 55 1000 37 602 31 777 34 1186 39 935 36 649 32 4506 53 650 32 785 34 710 33 2290 46 536 30 4150 52 1893 44 922 36 656 32 704 33 540 30 2285 46 1081 38 712 33 4560 53 1164 39 705 33 1880 44 937 36 4475 53 1009 37 850 35 930 36 848 35 1557 42 1175 39 1576 42 1572…
- Company Competitor 1383 1153 2022 1067 2429 1296 901 1406 2219 1254 1896 1335 1910 1204 1539 1076 2048 1246 2881 1098 2395 1258 1349 955 2052 954 2675 1363 1588 1022 2704 1155 3148 1807 2822 1295 2217 1116 2260 1323 3040 1326 3137 1107 2977 1163 2599 1254 2412 1017 3187 938 2598 1270 2995 1042 3046 1318 3858 1497 2438 750 3243 1380 2764 1053 2944 932 3324 1097 2797 1193 3914 1271 2766 843 2273 780 3052 1095 3202 1290 3672 937 3957 1390 3274 1056 3788 1235 3502 1235 2942 999 3078 1066 3196 641 3141 1322 3579 1289 3895 1060 above is the excel data, please solve the excel part with formulas and explanation, thanksAdams County, Nebraska 33,024 31,126 31,181 31,299 31,367 31,396 Antelope County, Nebraska 6,729 6,742 6,697 6,655 6,600 6,531 Arthur County, Nebraska 364 426 448 490 507 476 Banner County, Nebraska 824 720 703 778 816 788 Blaine County, Nebraska 471 539 585 584 586 594 Boone County, Nebraska 5,531 5,553 5,512 5,473 5,441 5,404 Box Butte County, Nebraska 11,031 11,372 11,383 11,345 11,312 11,308 Boyd County, Nebraska 2,120 2,107 2,095 2,025 2,093 2,067 Brown County, Nebraska 3,178 3,192 3,153 3,183 3,167 3,090 Buffalo County, Nebraska 44,877 45,437 45,842 46,330 46,885 47,388 Burt County, Nebraska 7,047 6,964 6,901 6,829 6,748 6,690 Butler County, Nebraska 8,416 8,382 8,360 8,345 8,334 8,312 Cass County, Nebraska 25,495 25,246 25,230 25,214 25,222 25,315 Cedar County, Nebraska 8,582 8,906 8,839 8,807 8,790 8,736 Chase County, Nebraska 3,702 3,927 3,937 3,964 3,984 3,990 Cherry County, Nebraska 5,682 5,783 5,750 5,722 5,735 5,749 Cheyenne County, Nebraska…Wages LOS 48.3355 94 49.0279 48 40.8817 102 36.5854 20 46.7596 60 59.5238 78 39.1304 45 39.2465 39 40.2037 20 38.1563 65 50.0905 76 46.9043 48 43.1894 61 60.5637 30 97.6801 70 48.5795 108 67.1551 61 38.7847 10 51.8926 68 51.8326 54 64.1026 24 54.9451 222 43.8095 58 43.3455 41 61.9893 153 40.0183 16 50.7143 43 48.84 96 34.3407 98 80.5861 150 33.7163 124 60.3792 60 48.84 7 38.5579 22 39.276 57 47.6564 78 44.6864 36 45.7875 83 65.6288 66 33.5775 47 41.2088 97 67.9096 228 43.0942 27 40.7 48 40.5748 7 39.6825 74 50.1742 204 54.9451 24 32.3822 13 51.713 30 55.8379 95 54.9451 104 70.2786 34 57.2344 184 54.1126 156 39.8687 25 27.4725 43 67.9584 36 44.9317 60 51.5612 102 This is the data given to us