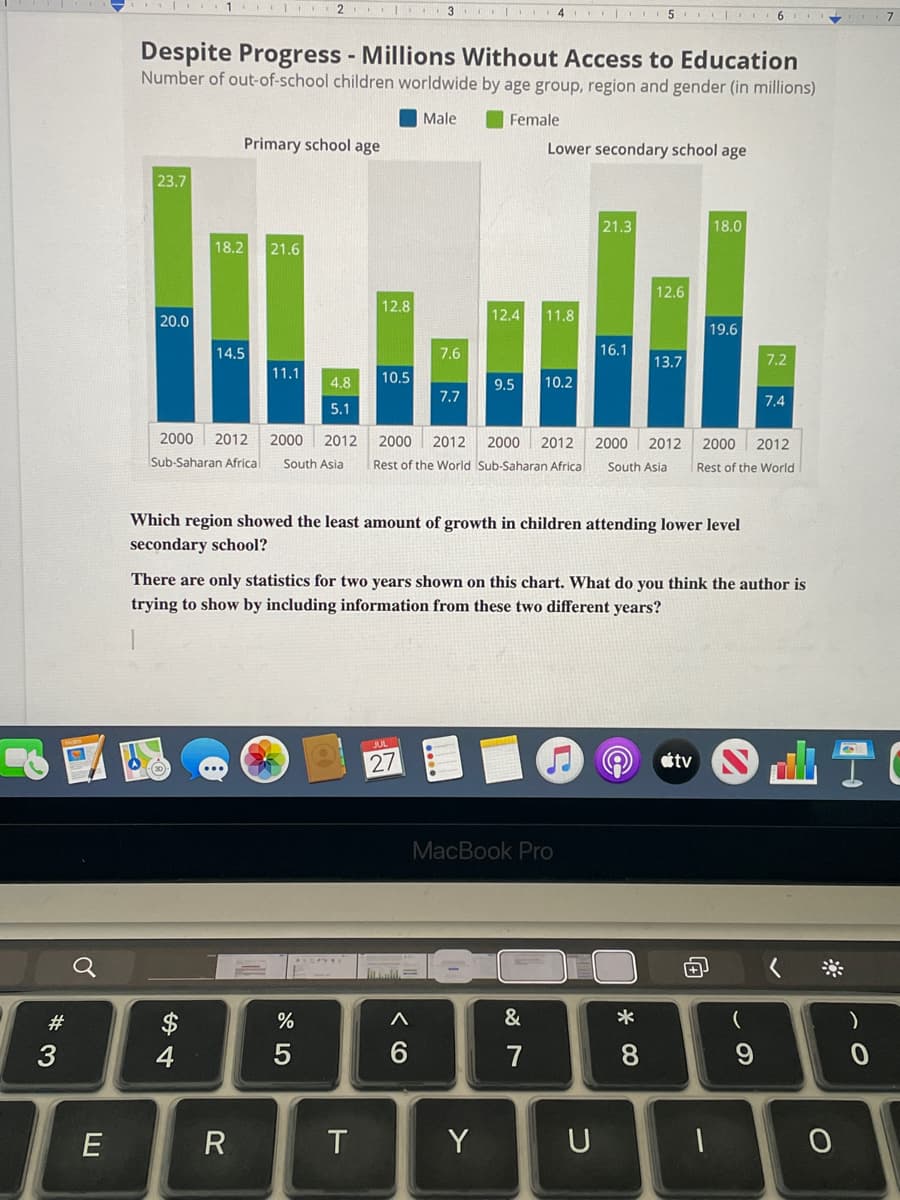
Despite Progress - Millions Without Access to Education Number of out-of-school children worldwide by age group, region and gender (in millions) Male Female 23.7 20.0 Primary school age 18.2 21.6 14.5 11.1 4.8 5.1 2000 2012 2000 2012 Sub-Saharan Africa South Asia 12.8 10.5 7.6 7.7 12.4 9.5 Lower secondary school age 11.8 10.2 21.3 16.1 12.6 13.7 2000 2012 2000 2012 2000 2012 Rest of the World Sub-Saharan Africa South Asia 18.0 19.6 7.2 Which region showed the least amount of growth in children attending lower level secondary school? 7.4 2000 2012 Rest of the World There are only statistics for two years shown on this chart. What do you think the author is trying to show by including information from these two different years?
Despite Progress - Millions Without Access to Education Number of out-of-school children worldwide by age group, region and gender (in millions) Male Female 23.7 20.0 Primary school age 18.2 21.6 14.5 11.1 4.8 5.1 2000 2012 2000 2012 Sub-Saharan Africa South Asia 12.8 10.5 7.6 7.7 12.4 9.5 Lower secondary school age 11.8 10.2 21.3 16.1 12.6 13.7 2000 2012 2000 2012 2000 2012 Rest of the World Sub-Saharan Africa South Asia 18.0 19.6 7.2 Which region showed the least amount of growth in children attending lower level secondary school? 7.4 2000 2012 Rest of the World There are only statistics for two years shown on this chart. What do you think the author is trying to show by including information from these two different years?

Linear Algebra: A Modern Introduction
4th Edition
ISBN:9781285463247
Author:David Poole
Publisher:David Poole
Chapter4: Eigenvalues And Eigenvectors
Section4.6: Applications And The Perron-frobenius Theorem
Problem 25EQ

Related questions
Question
Transcribed Image Text:#3
E
Despite Progress - Millions Without Access to Education
Number of out-of-school children worldwide by age group, region and gender (in millions)
Male
Female
23.7
Primary school age
18.2 21.6
k...
12.8
14.5
7.6
11.1
4.8 10.5
7.7
5.1
1 2 3 4
20.0
2000 2012 2000 2012
Sub-Saharan Africa South Asia
54
R
%
5
T
2000 2012 2000 2012
Rest of the World Sub-Saharan Africa
27
12.4 11.8
A
6
Lower secondary school age
9.5 10.2
Y
Which region showed the least amount of growth in children attending lower level
secondary school?
MacBook Pro
&
7
21.3
5. 6
16.1
There are only statistics for two years shown on this chart. What do you think the author is
trying to show by including information from these two different years?
U
12.6
13.7
2000 2012
South Asia
8
tv
18.0
19.6
AJ
2000 2012
Rest of the World
-
7.2
(
7.4
9
O
)
0
7
Expert Solution
This question has been solved!
Explore an expertly crafted, step-by-step solution for a thorough understanding of key concepts.

Step by step
Solved in 3 steps

Recommended textbooks for you
Linear Algebra: A Modern Introduction
Algebra
ISBN:
9781285463247
Author:
David Poole
Publisher:
Cengage Learning

Big Ideas Math A Bridge To Success Algebra 1: Stu…
Algebra
ISBN:
9781680331141
Author:
HOUGHTON MIFFLIN HARCOURT
Publisher:
Houghton Mifflin Harcourt

Glencoe Algebra 1, Student Edition, 9780079039897…
Algebra
ISBN:
9780079039897
Author:
Carter
Publisher:
McGraw Hill
Linear Algebra: A Modern Introduction
Algebra
ISBN:
9781285463247
Author:
David Poole
Publisher:
Cengage Learning
Big Ideas Math A Bridge To Success Algebra 1: Stu…
Algebra
ISBN:
9781680331141
Author:
HOUGHTON MIFFLIN HARCOURT
Publisher:
Houghton Mifflin Harcourt
Glencoe Algebra 1, Student Edition, 9780079039897…
Algebra
ISBN:
9780079039897
Author:
Carter
Publisher:
McGraw Hill