6. 300- Real estate is typically reassessed annually for property tax purposes. This assessed value, however, is not necessarily the same as the fair market value of the property. An SRS of 30 properties recently sold in a midwestern city was taken. The scatter plot below show the actual sales prices and the assessed values of the 30 properties. Both variables are measured in 250- 200- thousands of dollars. 150- Let y; and x; be respectively the sales price and the assessed value of the ith property. We use R to fit the regression model 100– Yi = Bo + B1Xi + Ei, Ei ~ i.i.d. N(0, ơ). 100 150 200 250 300 and yield the output below. Assessed Value ($1000) Call: Mean SD 1m(formula = Sales.Price ~ Assessed.Value) Assessed Value 184.13 45.43 Sales Price 195.84 47.18 Coefficients: Estimate Std. Error t value Pr(>|t]) (Intercept) 21.49923 15.27936 1.407 0.17 Assessed. Value 0.94682 0.08064 11.741 2.49e-12 *** --- Residual standard error: 19.73 on 28 degrees of freedom Multiple R-squared: 0.8312, F-statistic: 137.9 on 1 and 28 DF, Adjusted R-squared: 0.8251 p-value: 2.488e-12 What is the value of the slope of the regression line predicting the actual sales price from the assessed value? Interpret the slope of the regression line in the context of the data. Sales Price ($1000)
6. 300- Real estate is typically reassessed annually for property tax purposes. This assessed value, however, is not necessarily the same as the fair market value of the property. An SRS of 30 properties recently sold in a midwestern city was taken. The scatter plot below show the actual sales prices and the assessed values of the 30 properties. Both variables are measured in 250- 200- thousands of dollars. 150- Let y; and x; be respectively the sales price and the assessed value of the ith property. We use R to fit the regression model 100– Yi = Bo + B1Xi + Ei, Ei ~ i.i.d. N(0, ơ). 100 150 200 250 300 and yield the output below. Assessed Value ($1000) Call: Mean SD 1m(formula = Sales.Price ~ Assessed.Value) Assessed Value 184.13 45.43 Sales Price 195.84 47.18 Coefficients: Estimate Std. Error t value Pr(>|t]) (Intercept) 21.49923 15.27936 1.407 0.17 Assessed. Value 0.94682 0.08064 11.741 2.49e-12 *** --- Residual standard error: 19.73 on 28 degrees of freedom Multiple R-squared: 0.8312, F-statistic: 137.9 on 1 and 28 DF, Adjusted R-squared: 0.8251 p-value: 2.488e-12 What is the value of the slope of the regression line predicting the actual sales price from the assessed value? Interpret the slope of the regression line in the context of the data. Sales Price ($1000)

Glencoe Algebra 1, Student Edition, 9780079039897, 0079039898, 2018
18th Edition
ISBN:9780079039897
Author:Carter
Publisher:Carter
Chapter10: Statistics
Section10.6: Summarizing Categorical Data
Problem 23PPS

Related questions
Question
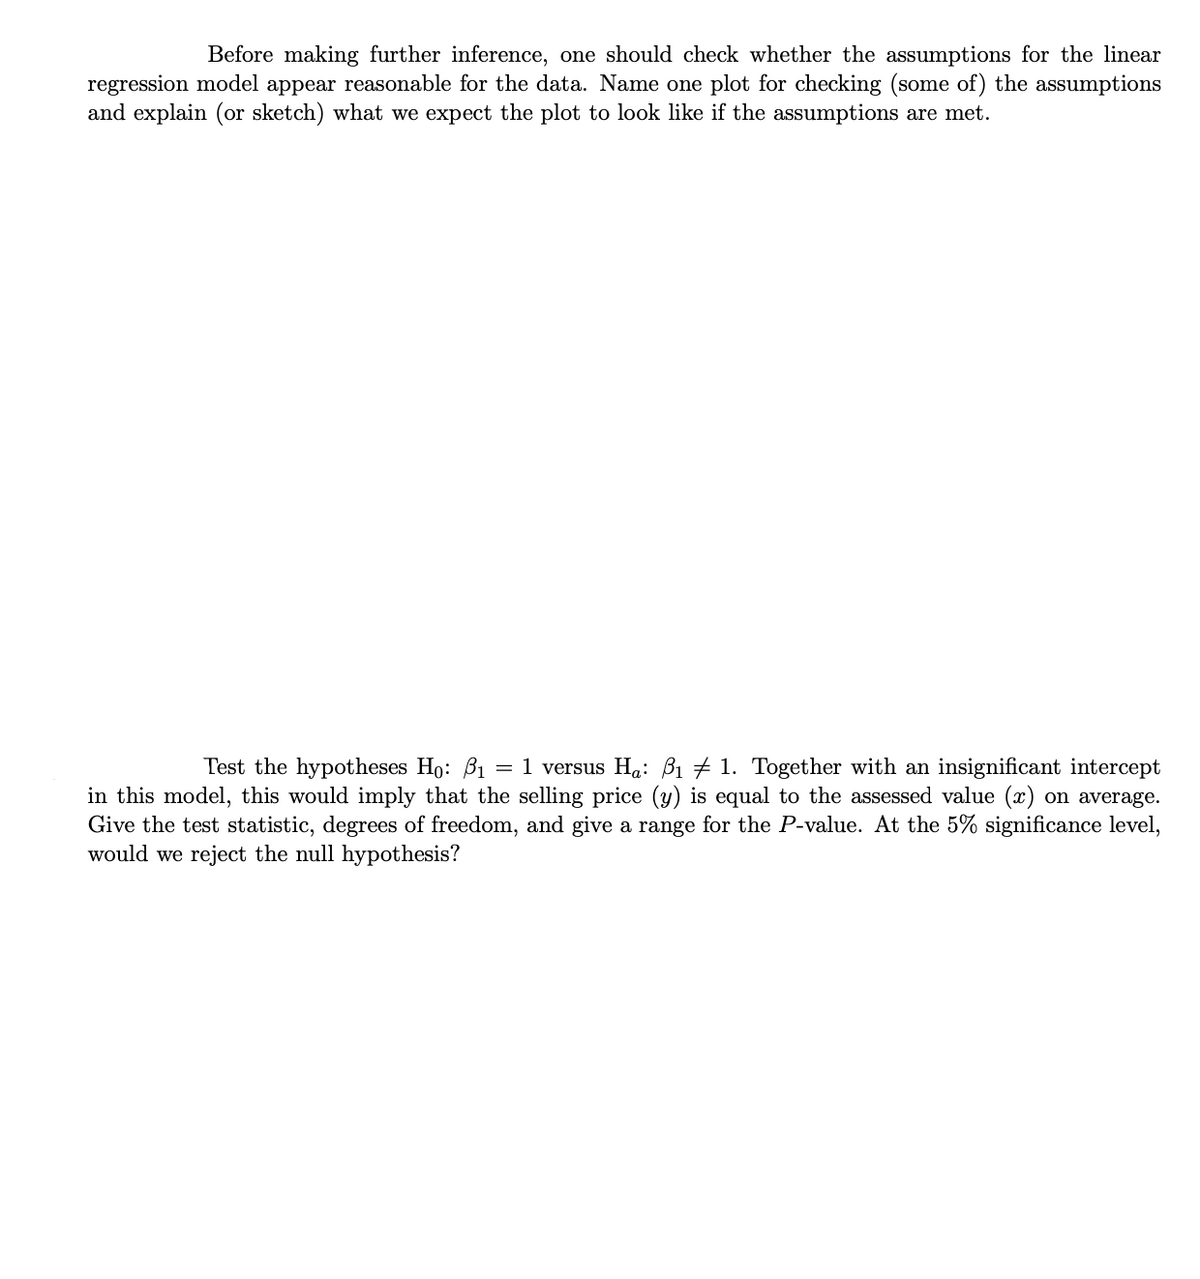
Transcribed Image Text:Before making further inference, one should check whether the assumptions for the linear
regression model appear reasonable for the data. Name one plot for checking (some of) the assumptions
and explain (or sketch) what we expect the plot to look like if the assumptions are met.
Test the hypotheses Ho: B1
1 versus Ha: B1 # 1. Together with an insignificant intercept
in this model, this would imply that the selling price (y) is equal to the assessed value (x) on average.
Give the test statistic, degrees of freedom, and give a range for the P-value. At the 5% significance level,
would we reject the null hypothesis?
Transcribed Image Text:6.
300-
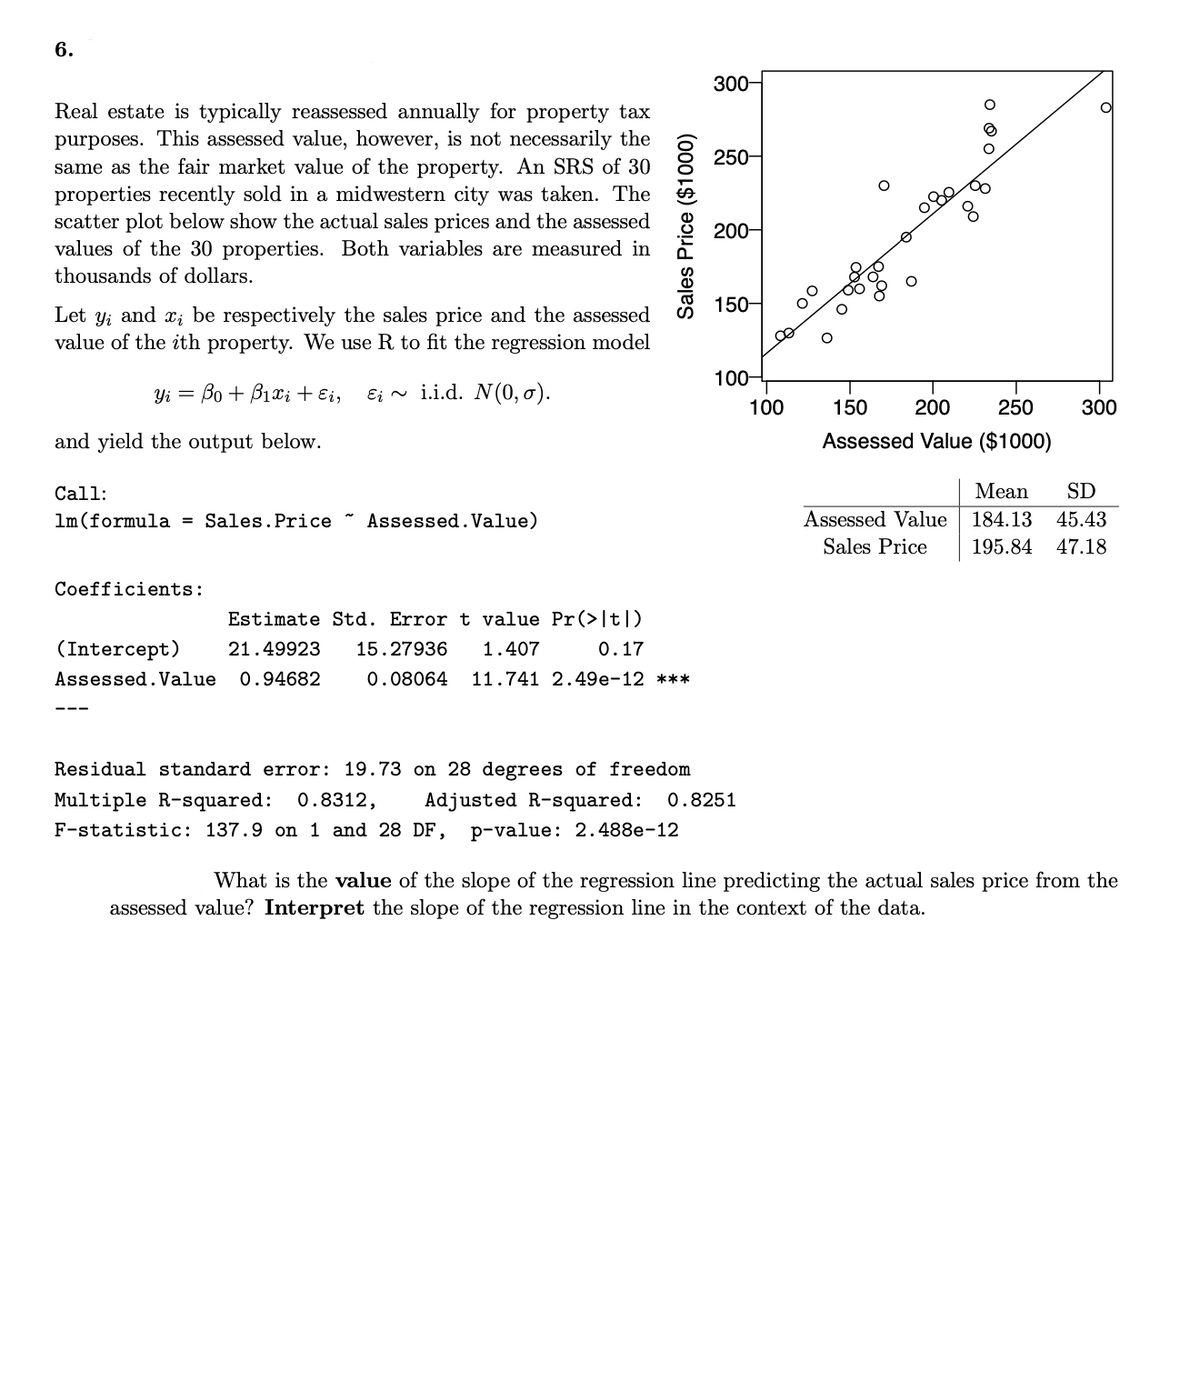
Real estate is typically reassessed annually for property tax
purposes. This assessed value, however, is not necessarily the
same as the fair market value of the property. An SRS of 30
properties recently sold in a midwestern city was taken. The
scatter plot below show the actual sales prices and the assessed
values of the 30 properties. Both variables are measured in
8 250-
200-
thousands of dollars.
150-
Let y; and x; be respectively the sales price and the assessed
value of the ith property. We use R to fit the regression model
100-
Yi =
Bo + B1xi + Ei,
Ei ~ i.i.d. N(0, o).
100
150
200
250
300
and yield the output below.
Assessed Value ($1000)
Call:
Mean
SD
1m (formula = Sales.Price *
Assessed. Value)
Assessed Value
184.13 45.43
Sales Price
195.84
47.18
Coefficients:
Estimate Std. Error t value Pr(>It|)
(Intercept)
Assessed. Value
21.49923
15.27936
1.407
0.17
0.94682
0.08064
11.741 2.49e-12 ***
Residual standard error: 19.73 on 28 degrees of freedom
Multiple R-squared: 0.8312,
Adjusted R-squared:
0.8251
F-statistic: 137.9 on 1 and 28 DF,
p-value: 2.488e-12
What is the value of the slope of the regression line predicting the actual sales price from the
assessed value? Interpret the slope of the regression line in the context of the data.
Sales Price ($1000)
00
Expert Solution
This question has been solved!
Explore an expertly crafted, step-by-step solution for a thorough understanding of key concepts.

This is a popular solution!

Trending now
This is a popular solution!

Step by step
Solved in 4 steps

Recommended textbooks for you
Glencoe Algebra 1, Student Edition, 9780079039897…
Algebra
ISBN:
9780079039897
Author:
Carter
Publisher:
McGraw Hill

Big Ideas Math A Bridge To Success Algebra 1: Stu…
Algebra
ISBN:
9781680331141
Author:
HOUGHTON MIFFLIN HARCOURT
Publisher:
Houghton Mifflin Harcourt
Glencoe Algebra 1, Student Edition, 9780079039897…
Algebra
ISBN:
9780079039897
Author:
Carter
Publisher:
McGraw Hill
Big Ideas Math A Bridge To Success Algebra 1: Stu…
Algebra
ISBN:
9781680331141
Author:
HOUGHTON MIFFLIN HARCOURT
Publisher:
Houghton Mifflin Harcourt