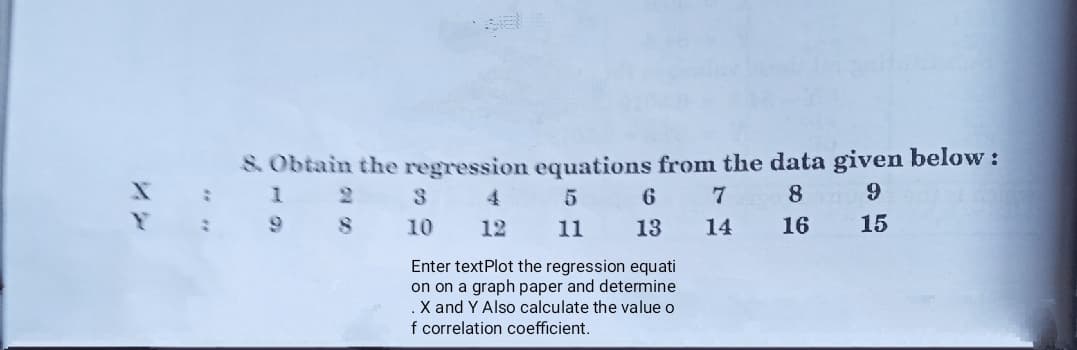
& Obtain the regression equations from the data given below: 1 2 9 8 3 4. 6. 8 10 12 11 13 14 16 15 Enter textPlot the regression equati on on a graph paper and determine X and Y Also calculate the value o f correlation coefficient.


Q: For the following set 4 data 13,16, 15, 22, 26, 32, 37, 37, 40, 44,47 55, 59, 62, 67,77,78, 83 a) Co...
A: Frequency polygon is a graph that used to represent the data set. It used to understand the spread o...
Q: In Shell Pulung Bulu, the yearly data of cars that have been serviced and the gross receipts are sho...
A: a From the provided information x y xy x2 361 3844 1387684 130321 270 1962 529740 72900 306...
Q: . Approximate the probability of fewer than 350 errors in a month. 2. Approximate a value so that th...
A: Phoenix water is provided to approximately 1.4 million people who are served through more than 362,0...
Q: Suppose that the data below are independent observations on random variables Y1, Y2, . Yı2 from an E...
A:
Q: You want to estimate the mean load needed to pull apart the pieces of wood to within a plus or minus...
A:
Q: Calculate Coefficient of Concurrent Deviations from the data given below : No. of Workers: 300 350 4...
A: Solution:
Q: 7: Calculate D, and D, for the data given below : Class-interval 0-10 10-20 20-30 30-40 40-50 50-60 ...
A:
Q: In 2006 the mean weight of men was believed to be 86.8 kg. To test for an increase in the weight a r...
A: Given μ=86.8n=100x¯=88.7s=11.64α=0.05
Q: Given a sample mean of 6.05, sample size of 35, and a margin of error 1.45, determine the associated...
A:
Q: Three containers contain the numbers 0, 1, and 2. Construct the sampling distribution of the sample ...
A:
Q: Number of roaches and pill bugs in each chamber over time(Light vs. dark)
A: Given information: The data represents the values of number of roaches and pill bugs (isopods) in ea...
Q: 1. For the following set of data. 13, 16, 15, 22, 26, 32, 37, 37, 40, 44, 47, 53, 55, 59, 62, 67, 77...
A:
Q: Let x denote the amount of gravel sold (in tons) during a randomly selected week at a particular sal...
A:
Q: Given: 4 = 43,0 3. What is the raw score when:
A: Let X be the raw score from normal distribution with mean (μ) = 45 and standard deviation (σ) =...
Q: Round up the following calculated sample size. Show your solutions. A. 1. n = 507.49 2. n = 247.51 3...
A: Given,n=507.49
Q: The sum of two numbers is 45. The first number is twice large as the second number. What are the num...
A:
Q: 1. Give below is the data on production of a company (in lakhs). Year: 1983 1984 1985 1986 1987 1988...
A:
Q: Calculate Coefficient of Concurrent Deviations from the data given below: No. of Workers: 300 350 40...
A: For the given concurrent variables we need to calculate the Coefficient of Concurrent Deviations f...
Q: The results of an investigation by an expert on a fire accident are summarised below: (i) The probab...
A:
Q: There are 10 red and 10 blue boxes in a cart. Determine the number of ways to arrange the 20 boxes o...
A:
Q: Purchases made at small "corner stores" were studied by the authors of a certain paper. Corner store...
A:
Q: What is the appropriate Alternative hypothesis for this problem? What test statistic will be used f...
A: It is given that Sample size n = 112 Sample mean = 2.00 Population SD = 1.20 Level of significance =...
Q: Let x denote the amount of gravel sold (in tons) during a randomly selected week at a particular sal...
A: For the given f(x ) Find (a) P (x> 1/4 ) = ? ( b ) P( X>=1/8 ) =>
Q: A person drives for 200 kilometres at a speed of 30 k.p.h. He drives another 200 kilometres at a spe...
A: Solution is given:
Q: 4. The data below represents the weights of patient fitted with a holter monitor (in pounds). 120 13...
A:
Q: Suppose that x has a beta distribution with parameters a = 2.4 and ß = 1. Determine to 4 decimal pla...
A: Solution
Q: A box contains 5 balls. Two are numbered 3, one is numbered 4, and two are numbered 5. The balls are...
A:
Q: Problem 3 The time T, in days, that it takes you to hand in your homework has an erponetial distribu...
A: Given,f(t)=e-t; t>00; otherwise
Q: An oil company conducts a geological study that indicates that an exploratory oil well should have a...
A: Define the random variable, its type of distribution, and compute for the variable/measure t...
Q: The test consist of 60 multiple-choice type of questions ranging over a wide variety of topic. The s...
A:
Q: ) If the probability of a student receiving financial aid is 0.72, find the mean and variance of the...
A: Given: probability of a student receiving financial aid is 0.72 p=0.72 number of students(n)=40000
Q: If the probability of a student graduating is 0.95, find the probability that more than 472 students...
A: Considering given student has the only options of "graduating" (i.e., success) or "not graduating" (...
Q: Suppose we have a uniform random variable U where -1 <u<1. There also exist {U%}f=1where each Ug are...
A: Hello! As you have posted more than 3 sub parts, we are answering the first 3 sub-parts. In case yo...
Q: For a population with u = 100 and o = 20, what is the X value corresponding to z = 1.50? O 130 O 30 ...
A:
Q: what is the range? give the correct answer. a. 49 b. 48 c. 79 d. 31
A: Range = Largest observation - smallest observation Here largest observation = 79 Smallest observatio...
Q: (c) Interpret each of the probabilities in part (b) and explain the difference between them. (1) P(5...
A: Given that, a playlist on a music player consists of 100 songs, of which seven are by a particular a...
Q: You wish to test the following claim (HaHa) at a significance level of α=0.02α=0.02. Ho:μ=80....
A:
Q: Question 1 You and your 4 other friends play 5 ranked games in Mobile Legends every day for the past...
A: E(X)=∑X.P(X)
Q: give the correct answer. compute the sample standard deviation. a. 6.96 b. 6.16 c. 7.12 d. 8.56
A:
Q: Calculate the Karl Pearson's coefficient of skewness from owing data : Size : 1 2 3 4 5 7 Frequency ...
A: Given: Size Frequency 1 10 2 18 3 30 4 25 5 12 6 3 7 2
Q: Calculate the first four moments about 30 for the following distribution and convert them into centr...
A: Concentration of all the values around the central value of the given data is known as measures of c...
Q: Given: 4 = 45, a = 3. What is the raw score when: 3. z = 2.14 4. z =-0.27
A:
Q: 2. In a certain barangay, a researcher wishes to determine whether the average expense of the famili...
A: Given,sample size(n)=15sample mean(x¯)=P 8500standard deviation(S)=P 1500α=0.01
Q: exact
A: Here use binomial distribution Finite number of toss Each trial is independent from each other Th...
Q: Fill in the blanks to complete the following statements. (a) For the shape of the distribution of th...
A: For the shape of the distribution of the sample proportion to be approximately normal, it is requi...
Q: size n=329n=329 in which there are 108 successes. What is the test statistic for this sample? (Repo...
A:
Q: Suppose an interval estimate for the population mean was 62.84 to 69.46. The population standard dev...
A: Given : Interval estimate for the population mean was 62.84 to 69.46 Population standard deviation (...
Q: For the followng set 4 data 13, 16, 15, 22, 26, 32,37, 37, 40,44, 47 55, 59, 62, 67,77,78, 83 a) Con...
A: Class boundaries : subtracting 0.5 from lower class limit and adding 0.5 to upper class limit. Count...
Q: Suppose that X has a lognormal distribution with parameters 0 = 2 and w² = 9. Determine the followin...
A: Note: P-value is taken from standard normal distribution table.
Q: (d) Compute the 10% trimmed mean. Compare with the results in (a) and (b) and comment.
A: Data is given : We have to calculate 10%trimmed mean 1 : we have to arrange the data 2 : remove 10%...

Step by step
Solved in 3 steps with 3 images

- Which of the following best describes a regression coefficient in a bivariate setting? a. The change in Y predicted by a unit change in X b. The slope of a line that minimizes the sum of squared residuals c. The correlation coefficient multiplied by SDy/SDx d. All of the aboveIn exercise 1, the following estimated regression equation based on 10 observations was presented. y^=29.1270+.5906x1+.4980x2Develop a point estimate of the mean value of y when x1=180 and x2=310. Predict an individual value of y when x1=180 and x2=310.b.Find the linear correlation coefficient, r, then determine whether there is sufficient evidence to support the claim of a linear correlation between the two variables. c. find the critical values
- A sample of n = 15 pairs of X and Y scores produces a Pearson correlation of r = 0.45, SSY = 90. a) If the regression equation was found for these scores, how much of the Y variability would be predicted by the regression equation (SSregression) and how much would not be predicted (SSresidual)? b) Does the regression equation predict a significant portion of the variability for the Y scores? (Equivalently, is the Pearson correlation significant?)A professor obtains SAT scores and freshman grade point averages (GPA) for a group of n=15 college students. The SAT scores have a mean of M=580 with SS=22,400, and GPA has a mean of 3.10 with SS=1.26, and SP=84. a. Find the regression equation for predicting GPA from SAT scores. b. What percentage of the variance in GPA is accounted for by the regression equation? (Compute the correlation, r, then find r2.) c. Does the regression equation account for a significant portion of the variance in GPA? Use α=.05 to evaluate the F-ratio.A professor obtains SAT scores and freshman grade point averages (GPAs) for a group of n = 15 college students. The SAT scores have a mean of M = 580 with SS = 22,400, and the GPAs have a mean of 3.10 with SS = 1.26, and SP = 84. A) Find the regression equation for predicting GPA from SAT scores. B) What percentage of the variance in GPAs is accounted for by the regression equation (i.e., compute the correlation, r, then find r2)? C) Does the regression equation account for a significant portion of the variance in GPA? Use a = .05 to evaluate the F-ratio.
- A professor obtains SAT scores and freshman grade point averages (GPAs) for a group of n=15 college students. The SAT scores have a mean of M=580 with SS = 22,400, and the GPAs have a mean of 3.10 with SS = 1.26, and SP = 84. Find the regression equation for predicting GPA from SAT scores. What percentage of the variance in GPAs is accounted for by the regression equation? (Compute the correlation, r, then find r2.) C) Does the regression equation account for a significant portion of the variance in GPA? Use alpha = 0.05 to evaluate the F-ratio. A) b=0.00375; a=0.925; Y (hat) = 0.00375X+0.925 B) r= 0.5 r^2= 0.25The following data shows the dexterity test scores of five assembly-line employees of Dimples Company Limited and their respective hourly productivity.Employee Score on dexterity test (?) Ali 12Kofi 14Kwesi 17Abudu 16Nana 11Units produced in an hour (?) 55636770 51You are required to(i) Write the regression equation(ii) Interpret the regression equation(iii) Calculate the Pearson’s Product Moment Correlation Coefficient.(iv) Interpret the correlation coefficient (v) Suppose the dexterity test score is 13, what would be the units produced in an hour? (vi) Clearly explain (in detail) the difference between regression analysis and correlation analysis.A group of students measure the length and width of a random sample of beans. They are interested in investigating the relationship between the length and width. Their summary statistics are displayed in the table below. All units, if applicable, are millimeters. Mean width: 7.555 Stdev width: 0.914 Mean height: 12.686 Stdev height: 1.634 Correlation coefficient: 0.8203 d) If the students are interested in using the height of the beans to predict the width, calculate the slope of this new regression equation. e) Write the equation of the best-fit line that can be used to predict bean widths. Use x to represent height and y to represent width.
- A regression between foot length(response variable in cm) and height (eexplanatory variable in inches) for 33 students resulted in the following regression equation: y^=10,9+0,23X one student in the sample was 73 inches tall with a foot length of 29cm.What is the predicted foot length for A)33cm B)17,57cm C)27,69cm D)29cmFind the Pearson r Correlation Coefficient: r = Blank 1 Find the equation of the regression line: y = Blank 2x + Blank 3 Predict power consumption for an ambient temperature of 65 °F: Blank 4 BTUA set of n = 4 pairs of X and Y values has a Pearson correlation of r = 0.60 and SSY = 200. The standard error of estimate for the regression equation is _______. a. 8 points b. 10 points c. 6 points d. 4 points