6. Data from the Nati indicates that the mean price of a home in Denver, from April through June of 2012 was 260.7 thousand dollars. A random sample of 50 homes sold in 2013 had a mean price of 290.5 thousand dollars. a. Assume the population standard deviation is o=$150,000. Can you conclude that the mean price in 2013 differs from the mean price in April through June of 2012? Use a 5% significance level. b. Following is a boxplot of the data. Explain why it is unreasonable to assume that the population is approximately normally distributed. 200 400 600 800 c. Explain why the assumptions for the hypothesis test are satisfied even though the population is not normal.
6. Data from the Nati indicates that the mean price of a home in Denver, from April through June of 2012 was 260.7 thousand dollars. A random sample of 50 homes sold in 2013 had a mean price of 290.5 thousand dollars. a. Assume the population standard deviation is o=$150,000. Can you conclude that the mean price in 2013 differs from the mean price in April through June of 2012? Use a 5% significance level. b. Following is a boxplot of the data. Explain why it is unreasonable to assume that the population is approximately normally distributed. 200 400 600 800 c. Explain why the assumptions for the hypothesis test are satisfied even though the population is not normal.

Glencoe Algebra 1, Student Edition, 9780079039897, 0079039898, 2018
18th Edition
ISBN:9780079039897
Author:Carter
Publisher:Carter
Chapter10: Statistics
Section10.4: Distributions Of Data
Problem 19PFA

Related questions
Topic Video
Question
100%
I need to know how to identify what test should be run on a Ti83 or 84 calculator
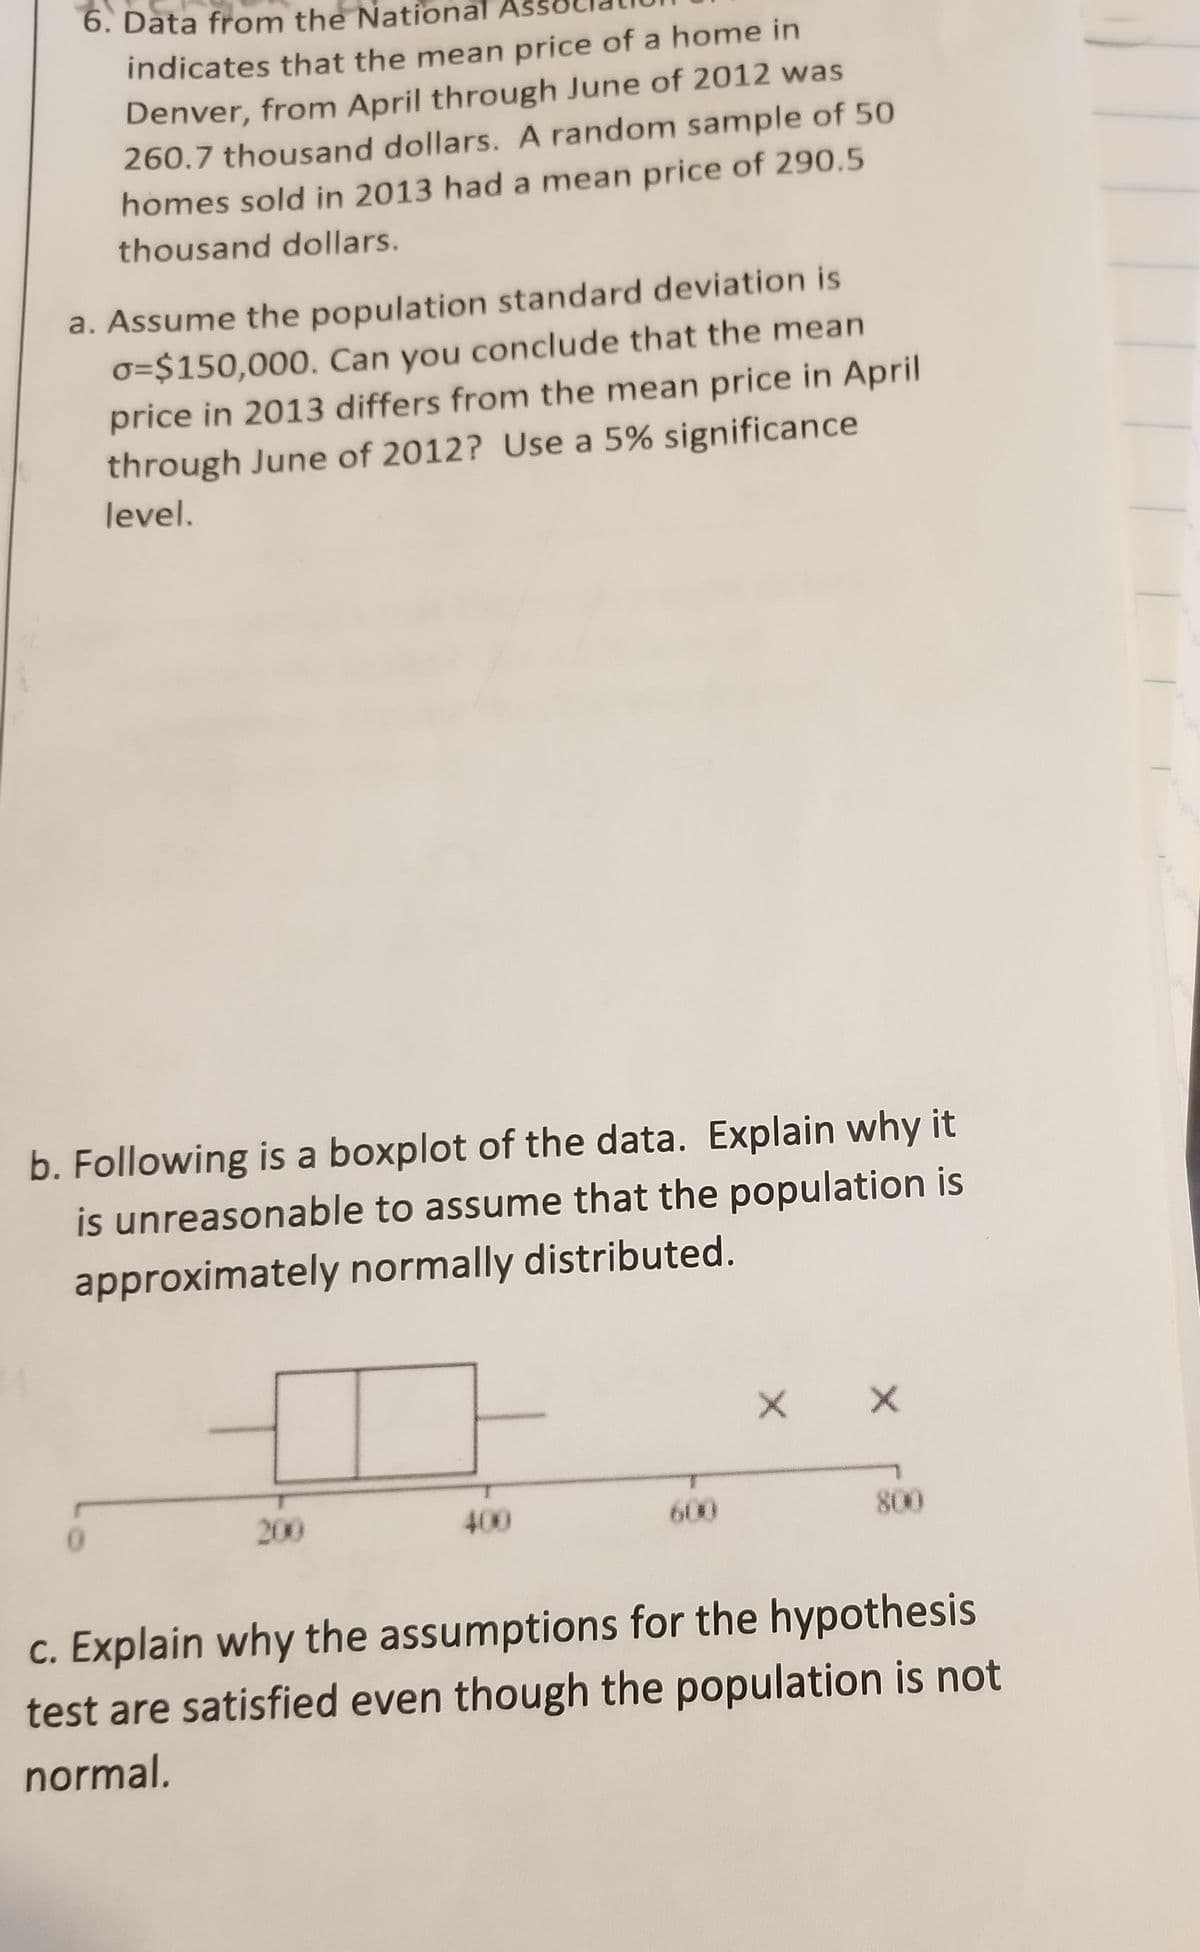
Transcribed Image Text:6. Data from the National
indicates that the mean price of a home in
Denver, from April through June of 2012 was
260.7 thousand dollars. A random sample of 50
homes sold in 2013 had a mean price of 290.5
thousand dollars.
a. Assume the population standard deviation is
o=$150,000. Can you conclude that the mean
price in 2013 differs from the mean price in April
through June of 2012? Use a 5% significance
level.
b. Following is a boxplot of the data. Explain why it
is unreasonable to assume that the population is
approximately normally distributed.
X X
200
400
600
800
0
c. Explain why the assumptions for the hypothesis
test are satisfied even though the population is not
normal.
Expert Solution
This question has been solved!
Explore an expertly crafted, step-by-step solution for a thorough understanding of key concepts.

This is a popular solution!

Trending now
This is a popular solution!

Step by step
Solved in 2 steps with 2 images

Knowledge Booster


Learn more about
Need a deep-dive on the concept behind this application? Look no further. Learn more about this topic, statistics and related others by exploring similar questions and additional content below.Recommended textbooks for you
Glencoe Algebra 1, Student Edition, 9780079039897…
Algebra
ISBN:
9780079039897
Author:
Carter
Publisher:
McGraw Hill
Glencoe Algebra 1, Student Edition, 9780079039897…
Algebra
ISBN:
9780079039897
Author:
Carter
Publisher:
McGraw Hill