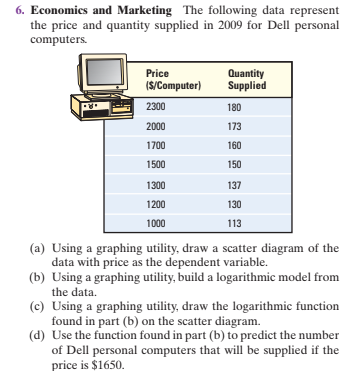
6. Economics and Marketing The following data represent the price and quantity supplied in 2009 for Dell personal computers. Price Quantity Supplied (S/Computer) 2300 180 2000 173 1700 160 1500 150 1300 137 1200 130 1000 113 (a) Using a graphing utility, draw a scatter diagram of the data with price as the dependent variable. (b) Using a graphing utility, build a logarithmic model from the data. (c) Using a graphing utility, draw the logarithmic function found in part (b) on the scatter diagram. (d) Use the function found in part (b) to predict the number of Dell personal computers that will be supplied if the price is $1650.
6. Economics and Marketing The following data represent the price and quantity supplied in 2009 for Dell personal computers. Price Quantity Supplied (S/Computer) 2300 180 2000 173 1700 160 1500 150 1300 137 1200 130 1000 113 (a) Using a graphing utility, draw a scatter diagram of the data with price as the dependent variable. (b) Using a graphing utility, build a logarithmic model from the data. (c) Using a graphing utility, draw the logarithmic function found in part (b) on the scatter diagram. (d) Use the function found in part (b) to predict the number of Dell personal computers that will be supplied if the price is $1650.

Functions and Change: A Modeling Approach to College Algebra (MindTap Course List)
6th Edition
ISBN:9781337111348
Author:Bruce Crauder, Benny Evans, Alan Noell
Publisher:Bruce Crauder, Benny Evans, Alan Noell
Chapter5: A Survey Of Other Common Functions
Section5.1: Logistic Functions
Problem 16E: Cable TV The following table shows the number C. in millions, of basic subscribers to cable TV in...

Related questions
Question
Transcribed Image Text:6. Economics and Marketing The following data represent
the price and quantity supplied in 2009 for Dell personal
computers.
Price
Quantity
Supplied
(S/Computer)
2300
180
2000
173
1700
160
1500
150
1300
137
1200
130
1000
113
(a) Using a graphing utility, draw a scatter diagram of the
data with price as the dependent variable.
(b) Using a graphing utility, build a logarithmic model from
the data.
(c) Using a graphing utility, draw the logarithmic function
found in part (b) on the scatter diagram.
(d) Use the function found in part (b) to predict the number
of Dell personal computers that will be supplied if the
price is $1650.
Expert Solution
This question has been solved!
Explore an expertly crafted, step-by-step solution for a thorough understanding of key concepts.

This is a popular solution!

Trending now
This is a popular solution!

Step by step
Solved in 3 steps with 3 images

Recommended textbooks for you
Functions and Change: A Modeling Approach to Coll…
Algebra
ISBN:
9781337111348
Author:
Bruce Crauder, Benny Evans, Alan Noell
Publisher:
Cengage Learning


Algebra & Trigonometry with Analytic Geometry
Algebra
ISBN:
9781133382119
Author:
Swokowski
Publisher:
Cengage
Functions and Change: A Modeling Approach to Coll…
Algebra
ISBN:
9781337111348
Author:
Bruce Crauder, Benny Evans, Alan Noell
Publisher:
Cengage Learning
Algebra & Trigonometry with Analytic Geometry
Algebra
ISBN:
9781133382119
Author:
Swokowski
Publisher:
Cengage