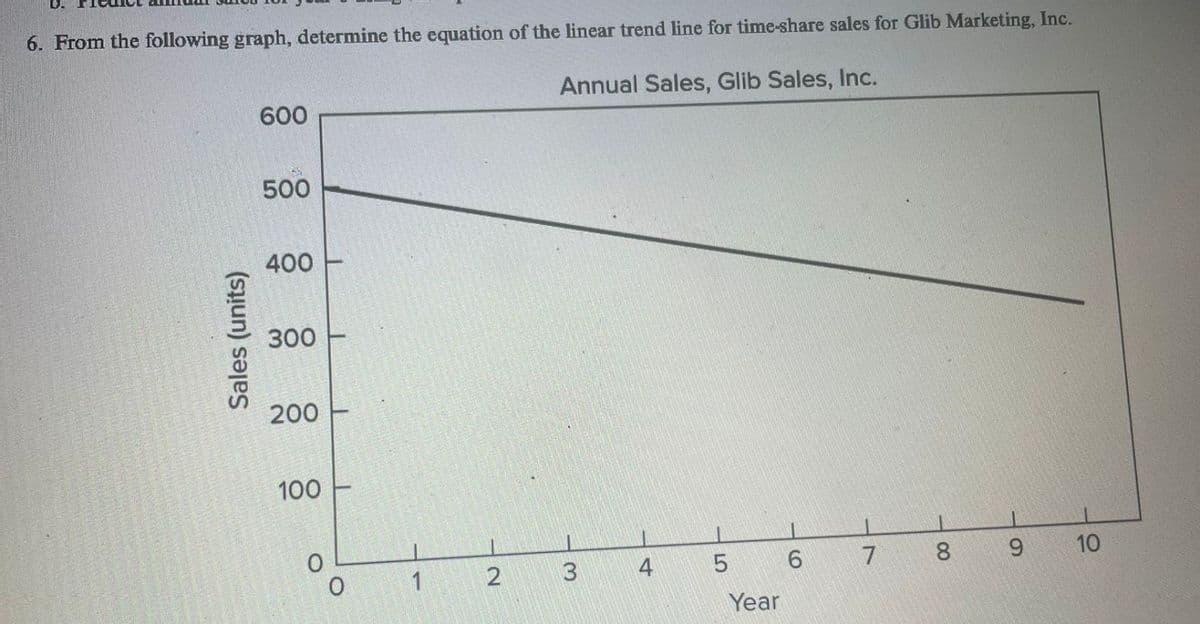
6. From the following graph, determine the equation of the linear trend line for time-share sales for Glib Marketing, Inc. Annual Sales, Glib Sales, Inc. Sales (units) 600 500 400 300 200 1 0 I I 100- 0 1 2 3 1 4 5 Year 6 7 -00 8 9 10


Q: Which of the following possible explanations of sticky prices is incorrect? a. menu costs (small…
A: Price-stickiness describes prices that do not adjust in response to macroeconomic changes.
Q: In this market, the equilibrium price is Price (Dollars per box) 15 35 For each of the prices listed…
A: The market equilibrium is determined by the intersection of the demand and supply curves. It is the…
Q: P P* Pw dump d a el I I I Q₂ f I I I C g I I h I I I I I I I 1 Q3 Q4 I I I Q5 D ermans are able to…
A: The consumer is the final user of any good or service. A consumer is a person who uses a good or…
Q: The ultimatum game is a game in economic experiments. The first player (the proposer) receives a sum…
A: In the realm of game theory, a subgame perfect equilibrium (SPNE) is an enhanced version of a Nash…
Q: Firm 2 Low Price Low Price 2 Firm 1 0 High Price 7 1 2 High Price 0 6 a. Does either firm have a…
A: Nash equilibrium is the point of a game corresponding to which each participant optimizes his…
Q: The difference between personal income and disposable income is savings personal taxes corporate…
A: Personal income refers to the total income acquired by individuals from all sources, including…
Q: If investors want portfolios with small risk, should they look for investments that have positive…
A: In layman's words, covariance measures how the prices of two assets in a portfolio move.Positive…
Q: Graphically illustrate the isoquant and the two isocost lines for the current combination of labor…
A: The following information is given: Labor cost (w) = $30 an hour Machinery cost (r) = $15 per…
Q: a. Calculate the growth rate of real GDP for each year from 1997 to 2001. The growth rate of real…
A: Gross domestic product reffers to the final values of goods and services produced in a territory of…
Q: Does Publix choose to utilize the monopolistically competitive market model?
A: Publix, a supermarket chain based in the america, operates in a highly competitive retail industry.…
Q: The following table presents the price and aggregate quantity of some goods in an economy in 2016…
A: CPI is a measure of the average price level of goods and services consumed by households or…
Q: stion 96 A decrease in the price of coffee, other things being equal, causes a(n): leftward shift in…
A: The demand curve is the graphical representation of the relationship between quantity demanded and…
Q: Could you also answer part (d) (e) (f). Greatly Appreciated!
A: Equilibrium refers to a state of balance or stability in a system where opposing forces or…
Q: Which of the following would cause a ceteris paribus increase in the price of petrol? a, A…
A: In an economy, the equilibrium price for oil and the equilibrium quantity will be decided at the…
Q: 6. Who should pay the tax? The following graph gives the labor market for laboratory aides in the…
A: The interaction of labor demand and labor supply determines the equilibrium wage rate and the…
Q: Population (in millions) 500- 400- € 300- 200- 100- 0 (1.260) (3,300) (1,100) (2,200) Time (in…
A: A population's growth rate is the rate at which its size varies over a predetermined amount of time.…
Q: The difference between personal income and disposable income is: savings personal taxes corporate…
A: Personal income refers to the total income received by individuals from various sources, such as…
Q: Wheat farmer Joe has the cost function of C(q) = 160,000 + 100q+q². The market for wheat is…
A: A market structure where numerous sellers and buyers interact and engage in trade, with each…
Q: Question 21: UK petrol price jumps above £1.50 as oil costs rise Fuel prices have hit record highs…
A: Demand refers to the quantity of good or service that a consumer is willing and able to buy at a…
Q: what will be the long-run expected real interest rate during these ten years?
A: To calculate the long run expected real interest rate, we will use following formula:
Q: Refer to figure 19.1 Bilateral Transboundary Pollution and the Economics of Reaching an Agreement $…
A: Marginal abatement cost (MAC) refers to the additional cost incurred to reduce one unit of pollution…
Q: The inverse demand curve a monopoly faces is p=130 - Q. The firm's cost curve is C(Q) = 20 +5Q. What…
A: Profit Maximization occurs when marginal revenue is equal to the marginal cost.1. Marginal Revenue…
Q: Since 1990, money supply in the Japanese economy has doubled. Over the same period, nominal GDP in…
A: ***Since you have posted 3 independent McQs under one question, according to our guidelines, only…
Q: Price 20 10 100 150 Quantity . If the price is 10, what is the quantity supplied? • If the price is…
A: Since you have posted multiple questions with multiple sub-parts, we will provide the solution only…
Q: On a supply and demand graph with the quantity of dollars on the horizontal axis and the price of…
A: Demand- the amount of a commodity, a buyer wants to purchase and is able to purchase at a given…
Q: FINANCIAL LITERACY 5. Say the following are deductions on a typical income, i. Pension deductions…
A: An income tax is a direct tax whose burden cannot be shifted to others. The person, it is imposed on…
Q: According to the interest rate effect, when the price falls, the interest rate Orises and the…
A: The interest rate effect suggests that alterations in price can have an impact on both the interest…
Q: If the current interest rate is higher than the coupon rate on the bond: The sale price will be less…
A: While the current interest rate is higher than the coupon price on a bond, it means that the…
Q: Findthe latest Consumer Price Index (CPI) numbers for the US and the UK and compute the nominal…
A: The global monetary system encompasses the intricate systems and procedures that oversee the…
Q: for Engines) The graph shows the domestic market for engines. If there is no international trade in…
A: From the graph, the equilibrium price is $600 and the…
Q: Consider the equations and graphs for the demand and supply functions given below, then answer the…
A: Equilibrium refers to a state of balance or stability in a system where opposing forces or…
Q: suppose pizzas and burgers are substitutes. what will definitely happen if there is an increase in…
A: The demanded quantity of any commodity reflects the amount of that commodity an individual is…
Q: Question 25 Explain and analyse the difference between direct and indirect taxation AND evaluate the…
A: Taxation is the cycle by which governments gather funds from people, businesses, and different…
Q: In the video Susan George refers to the World Bank, IMF & WTO as the “terrible triplets” and the…
A: Susan George's views are part of a broader critical perspective on these institutions that is shared…
Q: A state has a corporate tax rate of 9.6%. If the federal tax rate is 21%, what is the combined…
A: Introduction: In this discussion, we will be exploring the concept of tax rates and specifically…
Q: Based on the preceding graph showing the weekly market demand and supply curves, the price Zoomba…
A: A perfectly competitive firm is a price taker, which means it takes the price set by the market…
Q: The following table contains data for a hypothetical closed economy that uses the dollar as its…
A: GDP is the value of final goods and services produced in the economy within the given period of…
Q: Mutually beneficial trade is also called OA. self-sufficiency. OB. a zero- sum game. OC.…
A: Mutually beneficial trade is voluntary trade that occurs when two or more parties engage in a…
Q: DESCRIBE THE CURRENT STATE OF 2 INDICATORS [ i.e. inflation] IN THE PHILIPPINES AND HOW THEY AFFECT…
A: Economic indicators can be anything the government wishes, but particular data from government and…
Q: Explain the current Canadian unemploym rate in economic terms. No COVID-19 INCLUDED!!!
A: Unemployment refers to the situation of a individual of being without a job or work, despite he/she…
Q: 4. Tom’s Engel curve for ham and Tom’s Engel curve for green eggs, again assuming ph > pg. Please…
A: An Engel curve is a plot that demonstrates how demand for a particular good or service changes as…
Q: Fill in the missing values in the table of data collected in a labour force survey in October 2015…
A: Unemployment refers to the state of being without a job or occupation, typically measured as a…
Q: Can you help me this question Explain the short-run impact upon net exports and GDP of the…
A: The term "multiplier effect" refers to any adjustments in consumer spending that follow from any…
Q: You are studying a restaurant, that sells only pasta, and operates in a monopolistically competitive…
A: Total revenue determines the amount earned from the quantity produced.Economic costs involve not…
Q: The following graph plots the demand curve (blue line) for several consumers in the market for VR…
A: Consumer surplus can be defined as the difference between what a consumer is willing to pay and the…
Q: 2. In Almond country, farmers are experimenting with new genetically modified 'franken-bees' that…
A: Anit Bee group MC = -100 + Q Farmer's MC = Q Total bee hives in the country = 200 Damage of each bee…
Q: Question 7 The diagram below shows the aggregate demand and short-run aggregate supply curves for an…
A: AD shows negative relationship between the price level and real output on the other AS shows…
Q: Explain the concept of Globalization and discuss in detail three (3) pros and three (3) cons in…
A: Liberalization, Privatization, and Globalization, or LPG reforms are a set of policies adopted by…
Q: If the monthly outflow from unemployment equals 500,000 people and the average duration of an…
A: Unemployment alludes to the condition of being without a paid job or occupation while effectively…
Q: illustrate and explain the monetary policy that the Reserve Bank of Australia implemented when…
A: When Australia's inflation rate increased from 6.1% in June 2022 to 7.4% in January 2023, the…
If excel required then attached screenshot


Trending now
This is a popular solution!

Step by step
Solved in 3 steps


- Indicate whether each of the following relationships is usually a direct relationship or an inverse relationship. a. A sports team’s winning percentage and attendance at its home games. b. Higher temperatures and sweater sales. c. A person’s income and how often he or she shops at discount stores. d. Higher gasoline prices and miles driven in automobiles.13. List the basic trend patterns within the projection methods and determine which is the most commonly used when analyzing demand.A firm keeps a record of sales and prices over the past seven months, resulting in the following table: Price (ZMW/ton) Sales (tons) Nov. 1985 7.5 84.5 Dec. 8.0 82.0 Jan. 1986 8.0 84.0 Feb. 7.2 92.0 March 7.0 95.0 April 8.0 92.0 May 8.5 91.5 Use these observations to estimate demand as a linear function of both price and time. Further, utilise this function to estimate demand for the following month, on the assumption that: (a) price remains unchanged, (b) price increases to ZMW9/ton. Hence estimate the price elasticity of demand between these prices and find the price which would maximise sales revenue. Given the nature of the observations, comment on any difficulties in interpreting your results for decision-making purposes.
- In 2013, a certain company's annual revenue was 79 billion dollars and growing at the rate of 3.6x + 17.9 billion dollars per year, where x is the number of years since 2013. Find a formula to predict this company's annual revenue at any time x. I(x) = Use your formula to predict their revenue in 2022. (Round your answer to one decimal place.)21. Consider a firm subject to quarter-to-quarter variation in its sales. Suppose that the following equation was estimated using quarterly data for the period 2011–2018 (the time variable goes from 1 to 32). The variables D1, D2, and D3 are, respectively, dummy variables for the first, second, and third quarters (e.g., D1 is equal to 1 in the first quarter and 0 otherwise). Qt =a+bt+c1D1+c2D2+c3D3 The results of the estimation are presented here: a. Calculate the intercept in each of the four quarters. What do these values imply? b. Use this estimated equation to forecast sales in the fourth quarter of 2019.What are the correct relations between increasing and decreasing for all shown below?
- The following gives the number of accidents that occurred on Florida State Highway 101 during the last 4 months: Jan Feb Mar AprMonth 1 2 3 4Number of Accidents 30 40 70 105 Using the least-squares regression method, the trend equation for forecasting is (round your responses to two decimal places): y = ? + ?xShow with explanations and examples of the differences from trend analysis, cross sectional analysis, and industry comparables analysis.A local moving company has collected data on the number of moves they have been asked to perform over the past two years. Moving is highly seasonal, so the owner/operator, who is both burly and highly educated, decides to apply the multiplicative seasonal method to forecast the number of customers for the coming year. The equation for the trend line of yearly sales is Ft = 16 + 60t. Please forecast demand for each quarter in Year 3. (Round the forecasts to whole numbers and show all calculations). Complete the table below and forecast the sales of Year 3 by quarter. Year 1 Year 2 Year 3 Quarter Demand Seasonal Index Quarter Demand Seasonal Index Average Seasonal Index Forecast 1 20 1 27 2 40 2 45 3 45 3 55 4 31 4 41 Total Average
- Plot the following dataset and elaborate your concept regarding the graph: Quantity AC MC 0 110 - 100 80 40 200 55 20 300 45 45 400 55 80 500 80 120 600 110 160The monthly demand of a company is showed below, please use the static method to forecast the demand for Year 6. Sales Year 1 Year 2 Year 3 Year 4 Year 5 JAN 2,000 3,000 2,000 5,000 5,000 FEB 3,000 4,000 5,000 4,000 2,000 MAR 3,000 3,000 5,000 4,000 3,000 APR 3,000 5,000 3,000 2,000 2,000 MAY 4,000 5,000 4,000 5,000 7,000 JUN 6,000 8,000 6,000 7,000 6,000 JUL 7,000 3,000 7,000 10,000 8,000 AUG 6,000 8,000 10,000 14,000 10,000 SEP 10,000 12,000 15,000 16,000 20,000 OCT 12,000 12,000 15,000 16,000 20,000 NOV 14,000 16,000 18,000 20,000 22,000 DEC 8,000 10,000 8,000 12,000 8,000 Total 78,000 89,000 98,000 115,000 113,000There has been coherent effort by various national agencies to educate and encourage reduction in energy consumption among Singapore household over the years. As part of your social science school project, you have chosen to research on whether such campaign has found success among households living in 1-room and 2-room HDB flats. You have downloaded the latest town gas consumption data for further analysis.Comment on the underlying pattern in the average quarterly household town gas consumptions over 2010 Q1 – 2021 Q2. Assume that today is 1st August 2021.