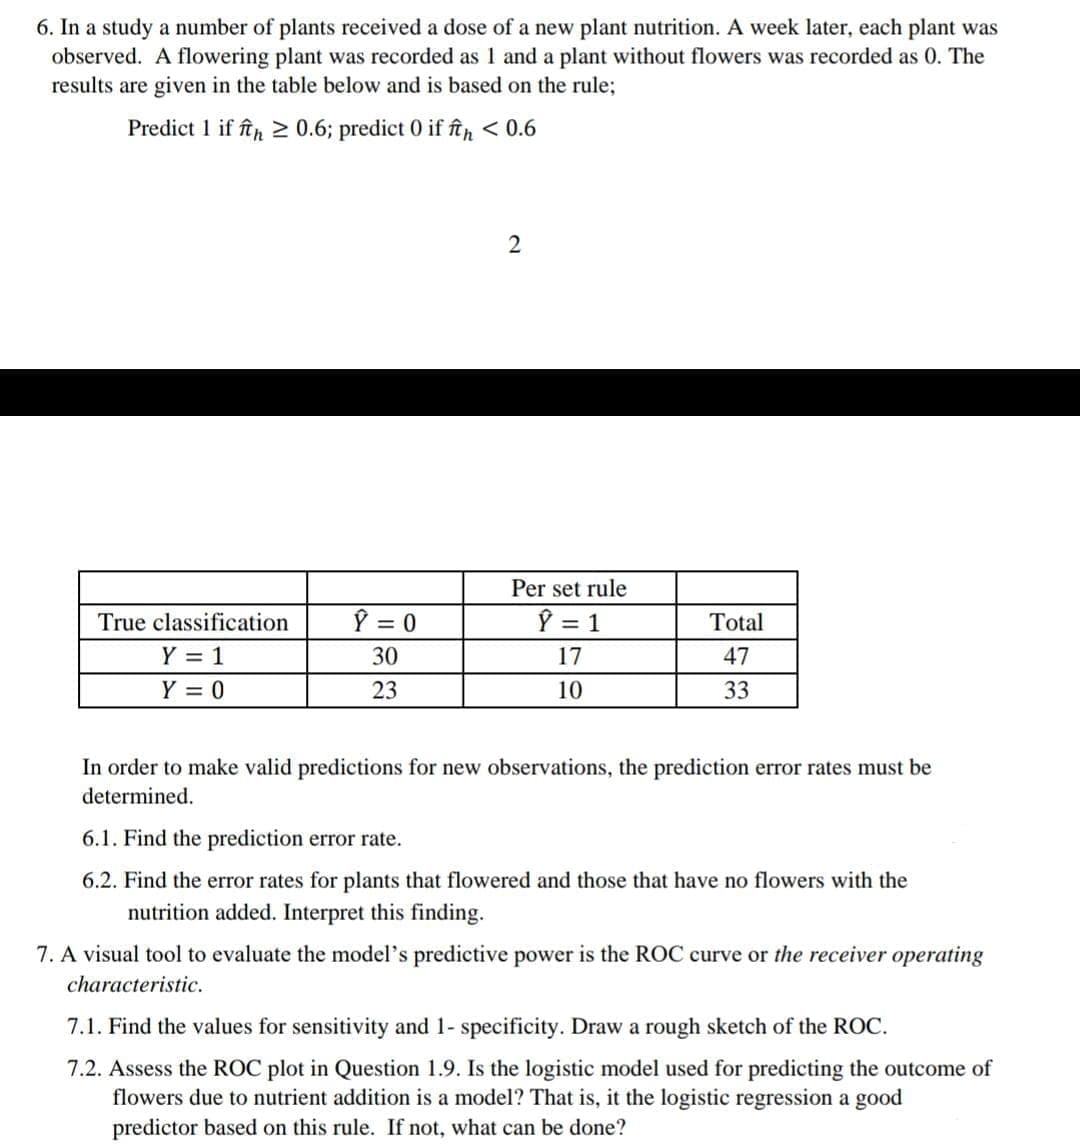
6. In a study a number of plants received a dose of a new plant nutrition. A week later, each plant was observed. A flowering plant was recorded as 1 and a plant without flowers was recorded as 0. The results are given in the table below and is based on the rule; Predict 1 if th≥ 0.6; predict 0 if ħ < 0.6 2 Per set rule
6. In a study a number of plants received a dose of a new plant nutrition. A week later, each plant was observed. A flowering plant was recorded as 1 and a plant without flowers was recorded as 0. The results are given in the table below and is based on the rule; Predict 1 if th≥ 0.6; predict 0 if ħ < 0.6 2 Per set rule

MATLAB: An Introduction with Applications
6th Edition
ISBN:9781119256830
Author:Amos Gilat
Publisher:Amos Gilat
Chapter1: Starting With Matlab
Section: Chapter Questions
Problem 1P

Related questions
Question
Transcribed Image Text:6. In a study a number of plants received a dose of a new plant nutrition. A week later, each plant was
observed. A flowering plant was recorded as 1 and a plant without flowers was recorded as 0. The
results are given in the table below and is based on the rule;
Predict 1 if th≥ 0.6; predict 0 if ft < 0.6
True classification
Y = 1
Y = 0
Y = 0
30
23
2
Per set rule
Ŷ = 1
17
10
Total
47
33
In order to make valid predictions for new observations, the prediction error rates must be
determined.
6.1. Find the prediction error rate.
6.2. Find the error rates for plants that flowered and those that have no flowers with the
nutrition added. Interpret this finding.
7. A visual tool to evaluate the model's predictive power is the ROC curve or the receiver operating
characteristic.
7.1. Find the values for sensitivity and 1- specificity. Draw a rough sketch of the ROC.
7.2. Assess the ROC plot in Question 1.9. Is the logistic model used for predicting the outcome of
flowers due to nutrient addition is a model? That is, it the logistic regression a good
predictor based on this rule. If not, what can be done?
Expert Solution
This question has been solved!
Explore an expertly crafted, step-by-step solution for a thorough understanding of key concepts.

Step by step
Solved in 3 steps with 3 images

Recommended textbooks for you
MATLAB: An Introduction with Applications
Statistics
ISBN:
9781119256830
Author:
Amos Gilat
Publisher:
John Wiley & Sons Inc

Probability and Statistics for Engineering and th…
Statistics
ISBN:
9781305251809
Author:
Jay L. Devore
Publisher:
Cengage Learning

Statistics for The Behavioral Sciences (MindTap C…
Statistics
ISBN:
9781305504912
Author:
Frederick J Gravetter, Larry B. Wallnau
Publisher:
Cengage Learning
MATLAB: An Introduction with Applications
Statistics
ISBN:
9781119256830
Author:
Amos Gilat
Publisher:
John Wiley & Sons Inc
Probability and Statistics for Engineering and th…
Statistics
ISBN:
9781305251809
Author:
Jay L. Devore
Publisher:
Cengage Learning
Statistics for The Behavioral Sciences (MindTap C…
Statistics
ISBN:
9781305504912
Author:
Frederick J Gravetter, Larry B. Wallnau
Publisher:
Cengage Learning

Elementary Statistics: Picturing the World (7th E…
Statistics
ISBN:
9780134683416
Author:
Ron Larson, Betsy Farber
Publisher:
PEARSON

The Basic Practice of Statistics
Statistics
ISBN:
9781319042578
Author:
David S. Moore, William I. Notz, Michael A. Fligner
Publisher:
W. H. Freeman

Introduction to the Practice of Statistics
Statistics
ISBN:
9781319013387
Author:
David S. Moore, George P. McCabe, Bruce A. Craig
Publisher:
W. H. Freeman