6. The class interval containing the D, 7. The frequency of the D, class. 8. The class interval containing the P 9. The lower boundary of the P class 90 10. The width of the class interval.
6. The class interval containing the D, 7. The frequency of the D, class. 8. The class interval containing the P 9. The lower boundary of the P class 90 10. The width of the class interval.

Glencoe Algebra 1, Student Edition, 9780079039897, 0079039898, 2018
18th Edition
ISBN:9780079039897
Author:Carter
Publisher:Carter
Chapter10: Statistics
Section: Chapter Questions
Problem 27SGR

Related questions

Concept explainers
Contingency Table
A contingency table can be defined as the visual representation of the relationship between two or more categorical variables that can be evaluated and registered. It is a categorical version of the scatterplot, which is used to investigate the linear relationship between two variables. A contingency table is indeed a type of frequency distribution table that displays two variables at the same time.
Binomial Distribution
Binomial is an algebraic expression of the sum or the difference of two terms. Before knowing about binomial distribution, we must know about the binomial theorem.
Topic Video
Question
Answer 6-10
Transcribed Image Text:281 to calculate
Use the frequency distribution in Try it 5 on
c. D.
'p.
a. D,
b. D,
and
Ckercises
Vocabulary and Concepts
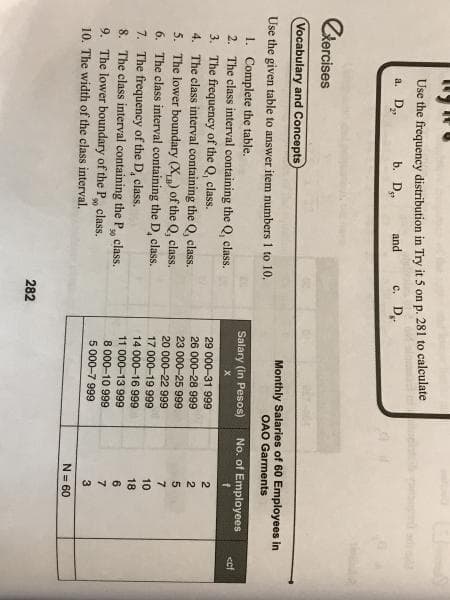
Monthly Salaries of 60 Employees in
OAO Garments
Use the given table to answer item numbers 1 to 10.
1. Complete the table.
2. The class interval containing the Q, class.
Salary (in Pesos)
No. of Employees
<ef
3. The frequency of the Q, class.
4. The class interval containing the Q, class.
5. The lower boundary (X,) of the Q, class.
6. The class interval containing the D, class.
7. The frequency of the D, class.
8. The class interval containing the P class.
9. The lower boundary of the P class.
10. The width of the class interval.
29 000-31 999
26 000-28 999
2
23 000-25 999
20 000-22 999
17 000-19 999
14 000-16 999
7
10
18
11 000-13 999
8 000-10 999
5 000-7 999
6.
30
7
3
N= 60
282
Expert Solution
This question has been solved!
Explore an expertly crafted, step-by-step solution for a thorough understanding of key concepts.

Step by step
Solved in 2 steps

Knowledge Booster


Learn more about
Need a deep-dive on the concept behind this application? Look no further. Learn more about this topic, statistics and related others by exploring similar questions and additional content below.Recommended textbooks for you
Glencoe Algebra 1, Student Edition, 9780079039897…
Algebra
ISBN:
9780079039897
Author:
Carter
Publisher:
McGraw Hill
Glencoe Algebra 1, Student Edition, 9780079039897…
Algebra
ISBN:
9780079039897
Author:
Carter
Publisher:
McGraw Hill