6. The following table shows the frequency distribution of ages of 25 employees in a company. Class Frequency 24-30 31-37 38-44 45-51 52-58 59-65 3 1 5 9 6 1 Find: a. Class boundaries b. Relative frequencies c. Modal class
6. The following table shows the frequency distribution of ages of 25 employees in a company. Class Frequency 24-30 31-37 38-44 45-51 52-58 59-65 3 1 5 9 6 1 Find: a. Class boundaries b. Relative frequencies c. Modal class

Glencoe Algebra 1, Student Edition, 9780079039897, 0079039898, 2018
18th Edition
ISBN:9780079039897
Author:Carter
Publisher:Carter
Chapter10: Statistics
Section: Chapter Questions
Problem 13PT

Related questions
Question
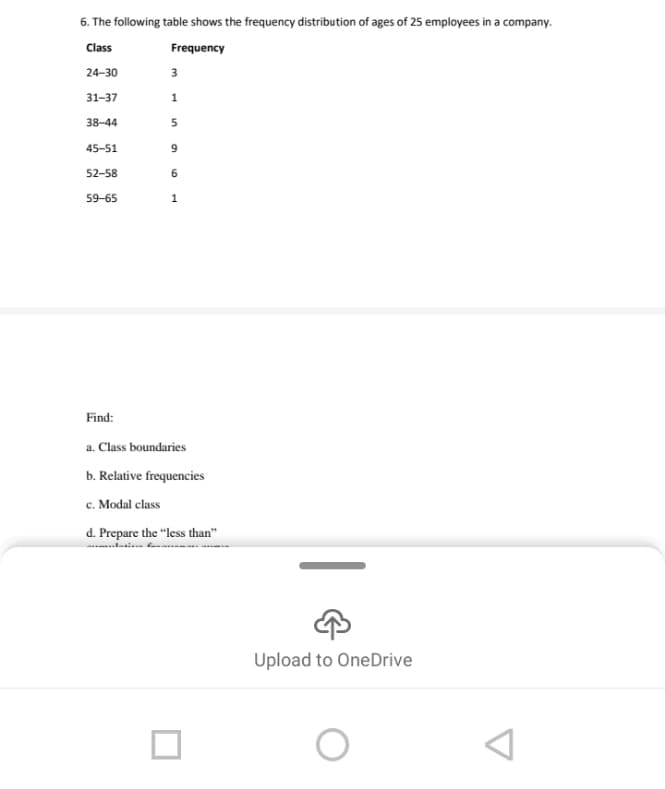
Transcribed Image Text:6. The following table shows the frequency distribution of ages of 25 employees in a company.
Class
Frequency
24-30
31-37
38-44
45-51
52-58
59-65
3
1
5
9
6
1
Find:
a. Class boundaries
b. Relative frequencies
c. Modal class
d. Prepare the "less than"
Upload to OneDrive
O
Expert Solution
This question has been solved!
Explore an expertly crafted, step-by-step solution for a thorough understanding of key concepts.

Step by step
Solved in 5 steps

Recommended textbooks for you
Glencoe Algebra 1, Student Edition, 9780079039897…
Algebra
ISBN:
9780079039897
Author:
Carter
Publisher:
McGraw Hill
Glencoe Algebra 1, Student Edition, 9780079039897…
Algebra
ISBN:
9780079039897
Author:
Carter
Publisher:
McGraw Hill