6.21. Parts manufactured by an injection molding process are subjected to a compressive strength test. Twenty samples of five parts each are col- lected, and the compressive strengths (in psi) are shown in Table 6E.12. (a) Establish x and R control charts for compressive strength using these data. Is the process in statis- tical control? (b) After establishing the control charts in part (a), 15 new subgroups were collected and the com- pressive strengths are shown in Table 6E.13. Plot the i and R values against the control units from part (a) and draw conclusions. 6.22. Reconsider the data presented in Exercise 6.21. (a) Rework both parts (a) and (b) of Exercise 6.21 using the x and s charts.
6.21. Parts manufactured by an injection molding process are subjected to a compressive strength test. Twenty samples of five parts each are col- lected, and the compressive strengths (in psi) are shown in Table 6E.12. (a) Establish x and R control charts for compressive strength using these data. Is the process in statis- tical control? (b) After establishing the control charts in part (a), 15 new subgroups were collected and the com- pressive strengths are shown in Table 6E.13. Plot the i and R values against the control units from part (a) and draw conclusions. 6.22. Reconsider the data presented in Exercise 6.21. (a) Rework both parts (a) and (b) of Exercise 6.21 using the x and s charts.

MATLAB: An Introduction with Applications
6th Edition
ISBN:9781119256830
Author:Amos Gilat
Publisher:Amos Gilat
Chapter1: Starting With Matlab
Section: Chapter Questions
Problem 1P

Related questions
Question
Focus on excercise 6.22
Very important Note:
Please to perform in excel and show formulas. (Show pictures)
perform in excel and show formulas
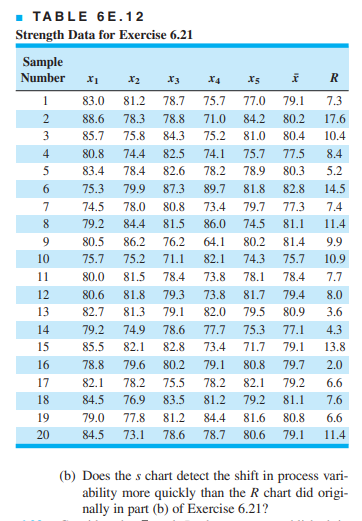
Transcribed Image Text:TABLE 6E.12
Strength Data for Exercise 6.21
Sample
Number
X3
X4
83.0
81.2
78.7
75.7
77.0
79.1
7.3
2
88.6
78.3
78.8
71.0
84.2
80.2
17.6
3
85.7
75.8
84.3
75.2
81.0
80.4
10.4
4
80.8
74.4
82.5
74.1
75.7
77.5
8.4
5
83.4
78.4
82.6
78.2
78.9
80.3
5.2
75.3
79.9
87.3
89.7
81.8
82.8
14.5
7
74.5
78.0
80.8
73.4
79.7
77.3
7.4
79.2
84.4
81.5
86.0
74.5
81.1
11.4
9
80.5
86.2
76.2
64.1
80.2
81.4
9.9
10
75.7
75.2
71.1
82.1
74.3
75.7
10.9
11
80.0
81.5
78.4
73.8
78.1
78.4
7.7
12
80.6
81.8
79.3
73.8
81.7
79.4
8.0
13
82.7
81.3
79.1
82.0
79.5
80.9
3.6
14
79.2
74.9
78.6
77.7
75.3
77.1
4.3
15
85.5
82.1
82.8
73.4
71.7
79.1
13,8
16
78.8
79.6
80.2
79.1
80.8
79.7
2.0
17
82.1
78.2
75.5
78.2
82.1
79.2
6.6
18
84.5
76.9
83.5
81.2
79.2
81.1
7.6
19
79.0
77.8
81.2
84.4
81.6
80.8
6.6
20
84.5
73.1
78.6
78.7
80.6
79.1
11.4
(b) Does the s chart detect the shift in process vari-
ability more quickly than the R chart did origi-
nally in part (b) of Exercise 6.21?
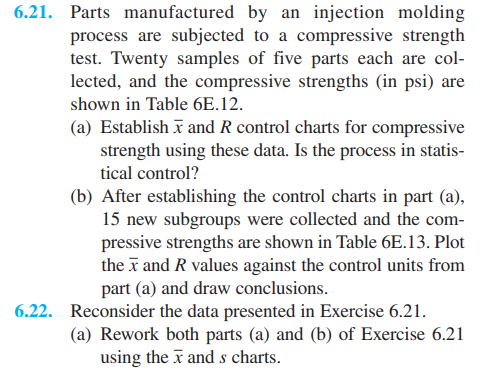
Transcribed Image Text:6.21. Parts manufactured by an injection molding
process are subjected to a compressive strength
test. Twenty samples of five parts each are col-
lected, and the compressive strengths (in psi) are
shown in Table 6E.12.
(a) Establish x and R control charts for compressive
strength using these data. Is the process in statis-
tical control?
(b) After establishing the control charts in part (a),
15 new subgroups were collected and the com-
pressive strengths are shown in Table 6E.13. Plot
the i and R values against the control units from
part (a) and draw conclusions.
6.22. Reconsider the data presented in Exercise 6.21.
(a) Rework both parts (a) and (b) of Exercise 6.21
using the x and s charts.
Expert Solution
This question has been solved!
Explore an expertly crafted, step-by-step solution for a thorough understanding of key concepts.

This is a popular solution!

Trending now
This is a popular solution!

Step by step
Solved in 2 steps with 3 images

Recommended textbooks for you
MATLAB: An Introduction with Applications
Statistics
ISBN:
9781119256830
Author:
Amos Gilat
Publisher:
John Wiley & Sons Inc

Probability and Statistics for Engineering and th…
Statistics
ISBN:
9781305251809
Author:
Jay L. Devore
Publisher:
Cengage Learning

Statistics for The Behavioral Sciences (MindTap C…
Statistics
ISBN:
9781305504912
Author:
Frederick J Gravetter, Larry B. Wallnau
Publisher:
Cengage Learning
MATLAB: An Introduction with Applications
Statistics
ISBN:
9781119256830
Author:
Amos Gilat
Publisher:
John Wiley & Sons Inc
Probability and Statistics for Engineering and th…
Statistics
ISBN:
9781305251809
Author:
Jay L. Devore
Publisher:
Cengage Learning
Statistics for The Behavioral Sciences (MindTap C…
Statistics
ISBN:
9781305504912
Author:
Frederick J Gravetter, Larry B. Wallnau
Publisher:
Cengage Learning

Elementary Statistics: Picturing the World (7th E…
Statistics
ISBN:
9780134683416
Author:
Ron Larson, Betsy Farber
Publisher:
PEARSON

The Basic Practice of Statistics
Statistics
ISBN:
9781319042578
Author:
David S. Moore, William I. Notz, Michael A. Fligner
Publisher:
W. H. Freeman

Introduction to the Practice of Statistics
Statistics
ISBN:
9781319013387
Author:
David S. Moore, George P. McCabe, Bruce A. Craig
Publisher:
W. H. Freeman