622) The accompanying table lists the cross-price elasticities of demand for several goods, where the percent quantity change is measured for the first good of the pair, and the percent price change is measured for the second good. Cross-price elasticities of demand Good Air-conditioning units and kilowatts of electricity Coke and Pepsi -0.38 +0.68 High-fuel-consuming sport-utility vehicles -0.30 (SUVS) and gasoline McDonald's burgers and Burger King burgers Butter and margarine a. Explain the sign of each of the cross-price elasticities. What does it imply about the relationship between the two goods in question? +0.88 +1.62 b. Compare the absolute values of the cross-price elasticities and explain their magnitudes. For example, why is the cross-price elasticity of McDonald's burgers and Burger King burgers less than the cross-price elasticity of butter and margarine? c. Use the information in the table to calculate how a 10% increase in the price of Pepsi affects the quantity of Coke demanded. d. Use the information in the table to calculate how a 5% decrease in the price of gasoline affects the quantity of SUVs demanded.
622) The accompanying table lists the cross-price elasticities of demand for several goods, where the percent quantity change is measured for the first good of the pair, and the percent price change is measured for the second good. Cross-price elasticities of demand Good Air-conditioning units and kilowatts of electricity Coke and Pepsi -0.38 +0.68 High-fuel-consuming sport-utility vehicles -0.30 (SUVS) and gasoline McDonald's burgers and Burger King burgers Butter and margarine a. Explain the sign of each of the cross-price elasticities. What does it imply about the relationship between the two goods in question? +0.88 +1.62 b. Compare the absolute values of the cross-price elasticities and explain their magnitudes. For example, why is the cross-price elasticity of McDonald's burgers and Burger King burgers less than the cross-price elasticity of butter and margarine? c. Use the information in the table to calculate how a 10% increase in the price of Pepsi affects the quantity of Coke demanded. d. Use the information in the table to calculate how a 5% decrease in the price of gasoline affects the quantity of SUVs demanded.

Essentials of Economics (MindTap Course List)
8th Edition
ISBN:9781337091992
Author:N. Gregory Mankiw
Publisher:N. Gregory Mankiw
Chapter5: Elastic And Its Application
Section: Chapter Questions
Problem 10PA

Related questions
Question
Hi, could you help me rosolve this question?
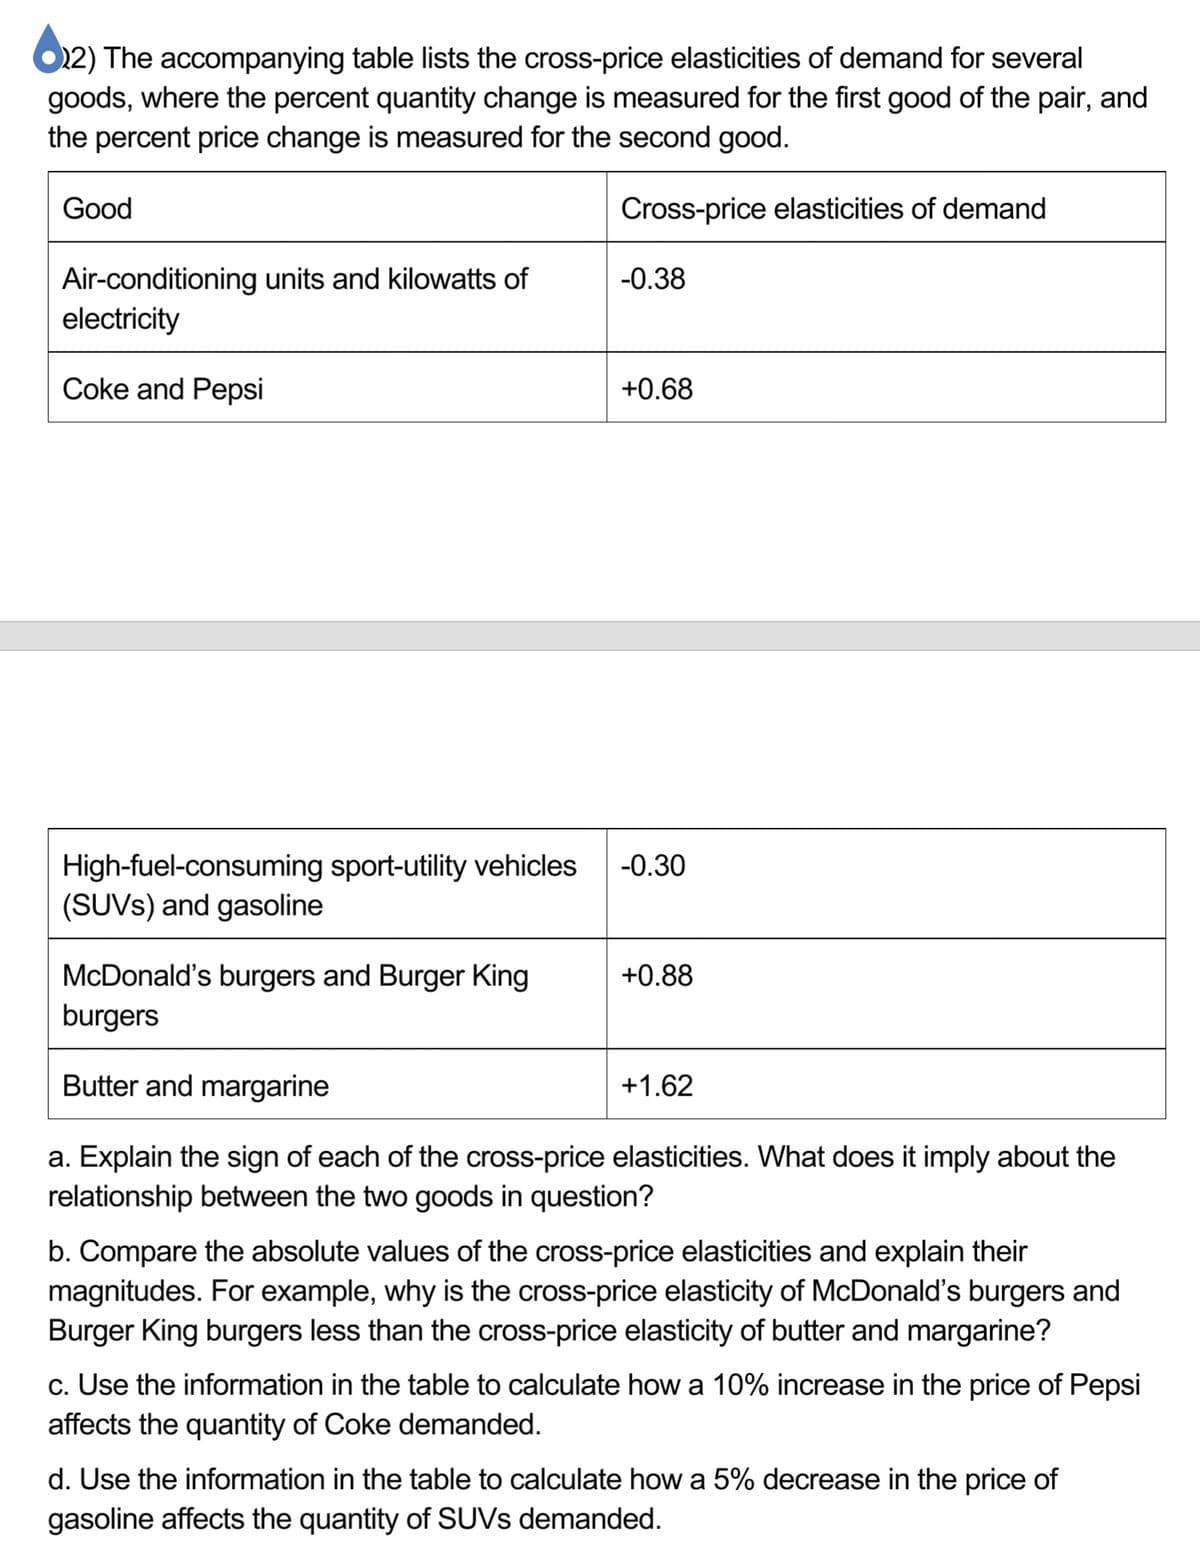
Transcribed Image Text:622) The accompanying table lists the cross-price elasticities of demand for several
goods, where the percent quantity change is measured for the first good of the pair, and
the percent price change is measured for the second good.
Cross-price elasticities of demand
Good
Air-conditioning units and kilowatts of
electricity
Coke and Pepsi
-0.38
+0.68
High-fuel-consuming sport-utility vehicles -0.30
(SUVS) and gasoline
McDonald's burgers and Burger King
burgers
Butter and margarine
a. Explain the sign of each of the cross-price elasticities. What does it imply about the
relationship between the two goods in question?
+0.88
+1.62
b. Compare the absolute values of the cross-price elasticities and explain their
magnitudes. For example, why is the cross-price elasticity of McDonald's burgers and
Burger King burgers less than the cross-price elasticity of butter and margarine?
c. Use the information in the table to calculate how a 10% increase in the price of Pepsi
affects the quantity of Coke demanded.
d. Use the information in the table to calculate how a 5% decrease in the price of
gasoline affects the quantity of SUVS demanded.
Expert Solution
This question has been solved!
Explore an expertly crafted, step-by-step solution for a thorough understanding of key concepts.

This is a popular solution!

Trending now
This is a popular solution!

Step by step
Solved in 5 steps

Knowledge Booster


Learn more about
Need a deep-dive on the concept behind this application? Look no further. Learn more about this topic, economics and related others by exploring similar questions and additional content below.Recommended textbooks for you
Essentials of Economics (MindTap Course List)
Economics
ISBN:
9781337091992
Author:
N. Gregory Mankiw
Publisher:
Cengage Learning


Principles of Microeconomics
Economics
ISBN:
9781305156050
Author:
N. Gregory Mankiw
Publisher:
Cengage Learning
Essentials of Economics (MindTap Course List)
Economics
ISBN:
9781337091992
Author:
N. Gregory Mankiw
Publisher:
Cengage Learning
Principles of Microeconomics
Economics
ISBN:
9781305156050
Author:
N. Gregory Mankiw
Publisher:
Cengage Learning

Principles of Economics 2e
Economics
ISBN:
9781947172364
Author:
Steven A. Greenlaw; David Shapiro
Publisher:
OpenStax

Exploring Economics
Economics
ISBN:
9781544336329
Author:
Robert L. Sexton
Publisher:
SAGE Publications, Inc